4: Structure determination, part I: Mass spectrometry, infrared, and UV-visible spectroscopy
Contents
4: Structure determination, part I: Mass spectrometry, infrared, and UV-visible spectroscopy#
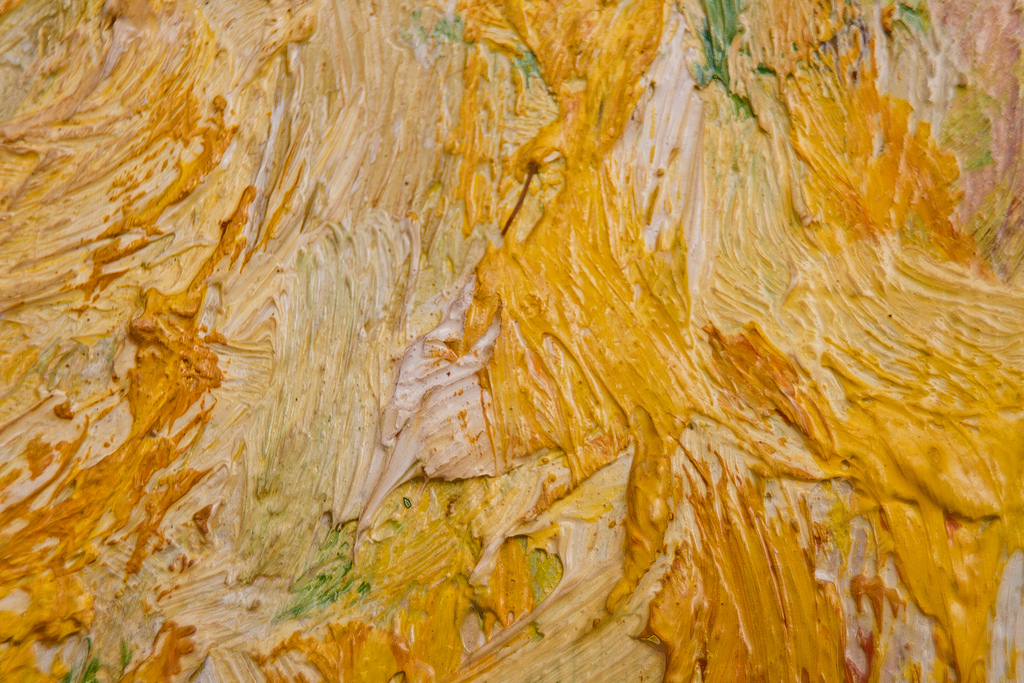
(Photo credit: https://www.flickr.com/photos/vamapaull/)
In the end, it was a ‘funky yellow color’ that led to the demise of Charles Heller’s not-so-illustrious career in the world of collectable art.
William Aiken Walker was a 19th-century ‘genre’ painter, known for his small scenes of sharecroppers working the fields in the post-Civil War south. For much of his career, he traveled extensively, throughout the southern states but also to New York City and even as far as Cuba. He earned a decent living wherever he went by setting up shop on the sidewalk and selling his paintings to tourists, usually for a few dollars each. While he never became a household name in the art world, he was prolific and popular, and his paintings are today considered collectible, often selling for upwards of ten thousand dollars.
In August, 1994, Robert Hicklin, an art gallery owner in Charleston, South Carolina, was appraising a Walker painting brought to him by another South Carolina art dealer named Rick Simons. Hicklin’s years of experience with Walker paintings told him that something just wasn’t right with this one - he was particularly bothered by one of the pigments used, which he later described in a story in the Maine Antique Digest as a ‘funky yellow color’. Reluctantly, he told Simons that it almost certainly was a fake.
Hoping that Hicklin was wrong, Simons decided to submit his painting to other experts for analysis, and eventually it ended up in the laboratory of James Martin, whose company Orion Analytical specializes in forensic materials analysis. Using a technique called infrared spectroscopy, Martin was able to positively identify the suspicious yellow pigment as an organic compound called ‘Pigment Yellow 3’.
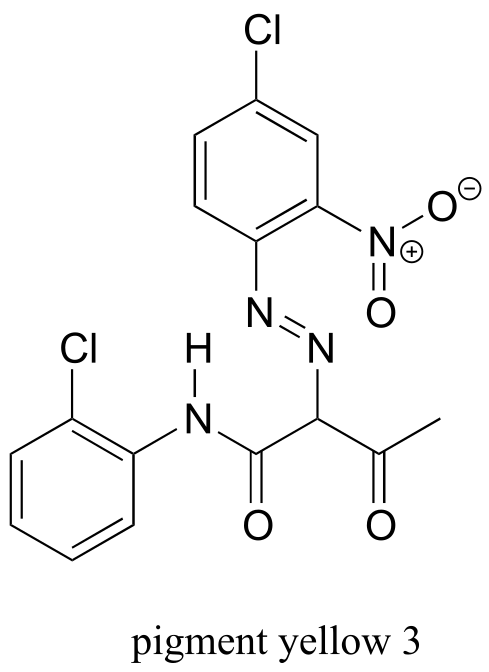
fig 1a
As it turns out, Pigment Yellow 3 had not become available in the United States until many years after William Aiken Walker died.
Simons had purchased his painting from a man named Robert Heller for $9,500. When Heller approached him again to offer several more Walker paintings for sale, Simons contacted the FBI. A few days later, with FBI agents listening in, Simons agreed to buy two more Walker paintings. When he received them, they were promptly analyzed and found to be fake. Heller, who turned out to be a convicted felon, was arrested and eventually imprisoned.
(You may want to check out a short article from the September 10, 2007 issue of Chemical and Engineering News for more about this story).
In the first three chapters of this text, we have focused our efforts on learning about the structure of organic compounds. Now that we know what organic molecules look like, we can begin to address, in the next two chapters, the question of how we get this knowledge in the first place. How are chemists able to draw with confidence the bonding arrangements in organic molecules, even simple ones such as acetone or ethanol? How was James Martin at Orion Analytical able to identify the chemical structure of the pigment compound responsible for the ‘funky yellow color’ in the forged William Aiken Walker painting?
This chapter is devoted to three very important techniques used by chemists to learn about the structures of organic molecules. First, we will learn how mass spectrometry can provide us with information about the mass of a molecule as well as the mass of fragments into which the molecule has been broken. Then, we will begin our investigation of molecular spectroscopy, which is the study of how electromagnetic radiation at different wavelengths interacts in different ways with molecules - and how these interactions can be quantified, analyzed, and interpreted to gain information about molecular structure. After a brief overview of the properties of light and the elements of a molecular spectroscopy experiment, we will move to a discussion of infrared (IR) spectroscopy, the key technique used in the detection of the Walker forgery, and a way to learn about functional groups present in an organic compound. Then, we will consider ultraviolet-visible (UV-vis) spectroscopy, with which chemists gain information about conjugated π-bonding systems in organic molecules, and how these conjugated systems are the basis for the color of some organic compounds, including pigment yellow #3. We will see how information from UV-vis spectroscopy can be used to measure the concentration of biomolecules in solution.
Looking ahead, Chapter 5 will be devoted to nuclear magnetic resonance (NMR) spectroscopy, where we use ultra-strong magnets and radio frequency radiation to learn about the electronic environment of individual atoms in a molecule and use this information to determine the atom-to-atom bonding arrangement. For most organic chemists, NMR is one of the most powerful analytical tools available in terms of the wealth of detailed information it can provide about the structure of a molecule.
In summary, the structure determination techniques we will be studying in this chapter and the next primarily attempt to address the following questions about an organic molecule:
Chapter 4:
Mass spectrometry (MS): What is the atomic weight of the molecule and its common fragments?
Infrared (IR) spectroscopy: what functional groups does the molecule contain?
Ultraviolet-visible (UV-Vis) spectroscopy: What is the nature of conjugated π-bonding systems in the molecule?
Chapter 5:
Nuclear magnetic resonance spectroscopy (NMR): What is the overall bonding framework of the molecule?
4.1: Mass Spectrometry#
Mass spectrometry (MS) is a powerful analytical technique widely used by chemists, biologists, medical researchers, and environmental and forensic scientists, among others. With MS, we are looking at the mass of a molecule, or of different fragments of that molecule.
4.1A: Overview of mass spectrometry#
There are many different types of MS instruments, but they all have the same three essential components:
1) First, there is an ionization source, where the molecule is given a positive electrical charge, either by removing an electron or by adding a proton.
2) Depending on the ionization method used, the ionized molecule may or may not break apart into a population of smaller fragments
3) Next in line there is a mass analyzer, where the positively-charged fragments are separated according to mass.
4) Finally, there is a detector, which detects and quantifies the separated ions.
One of the more common types of MS techniques used in the organic laboratory is electron ionization (EIMS). Although biomolecules are usually too polar for this technique, it is useful for the analysis of intermediates and products in laboratory synthesis, and is a good starting place to learn about MS in general. In a typical EIMS experiment, the sample molecule is bombarded by a high-energy electron beam, which has the effect of knocking a valence electron off of the molecule to form a radical cation. Because a great deal of energy is transferred by this bombardment process, the radical cation quickly begins to break up into smaller fragments, some of which are cations (both radical and non-radical) and some of which are neutral. A subset of the initially formed radical cations do not fragment at all - these are referred to as molecular ions. The neutral fragments are either adsorbed onto the walls of the chamber or are removed by a vacuum source. The molecular ion and all other cationic fragments are accelerated down a curved tube by an electric field.
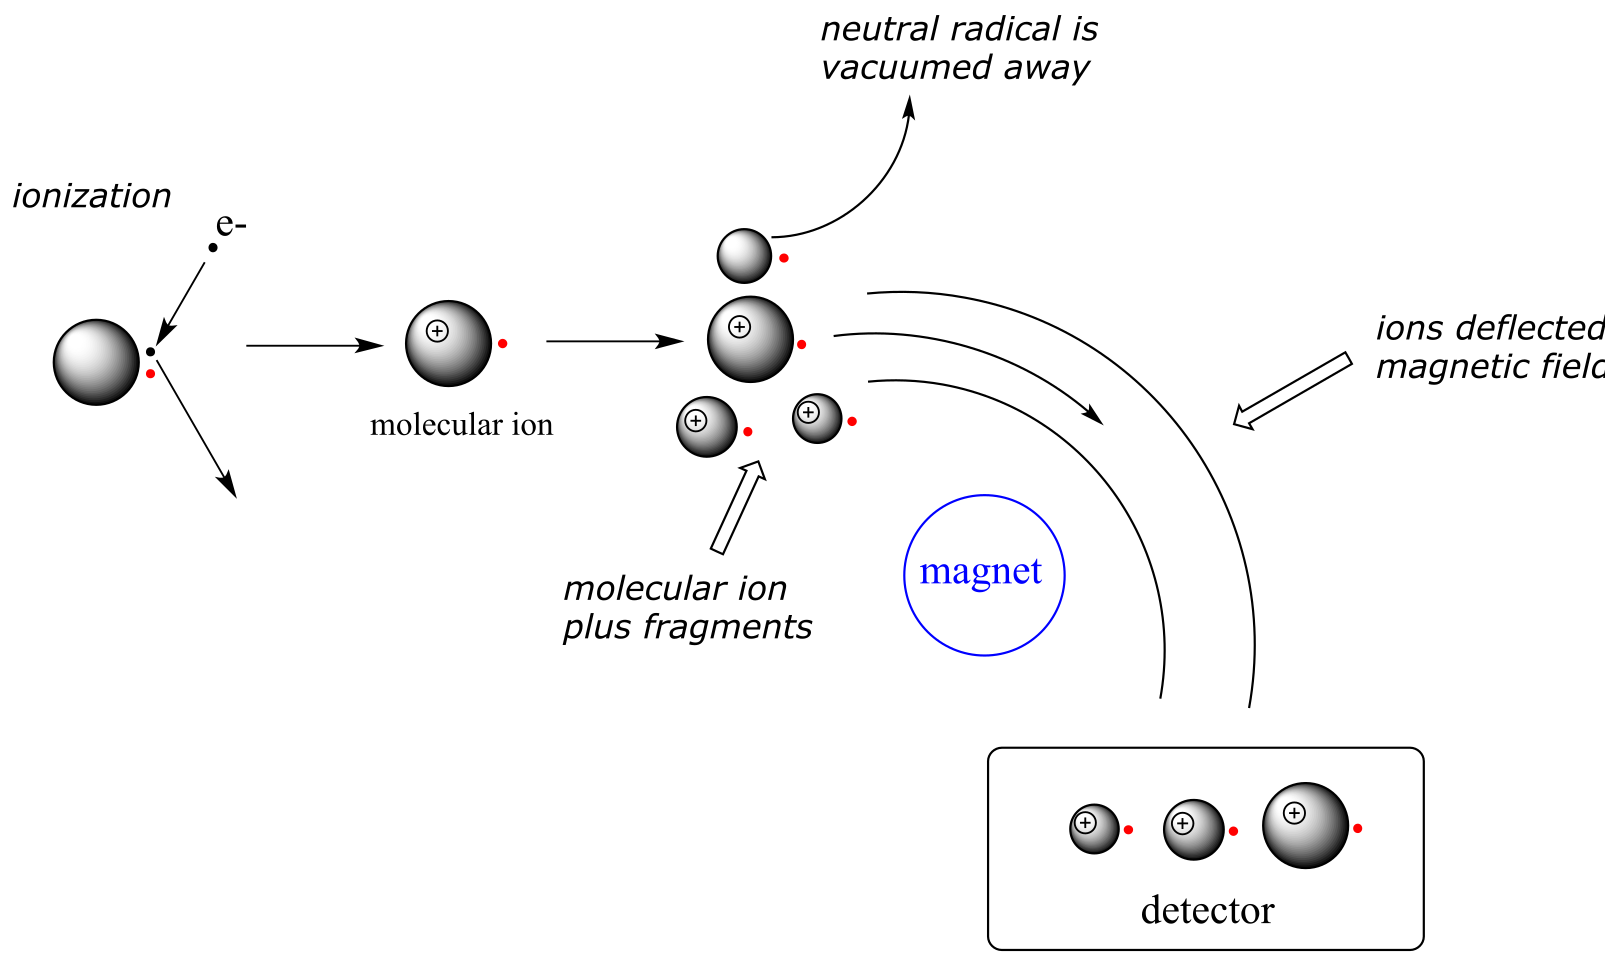
fig 26
As they travel down the curved tube, the ions are deflected by a strong magnetic field. Cations of different mass to charge (m/z) ratios are deflected to a different extent, resulting in a sorting of ions by mass (virtually all ions have charges of z = +1, so sorting by the mass to charge ratio is essentially the same thing as sorting by mass). A detector at the end of the curved flight tube records and quantifies the sorted ions.
4.1B: Looking at mass spectra#
Below is typical output for an electron-ionization MS experiment (MS data in the section is derived from the Spectral Database for Organic Compounds, a free, web-based database of spectra.)
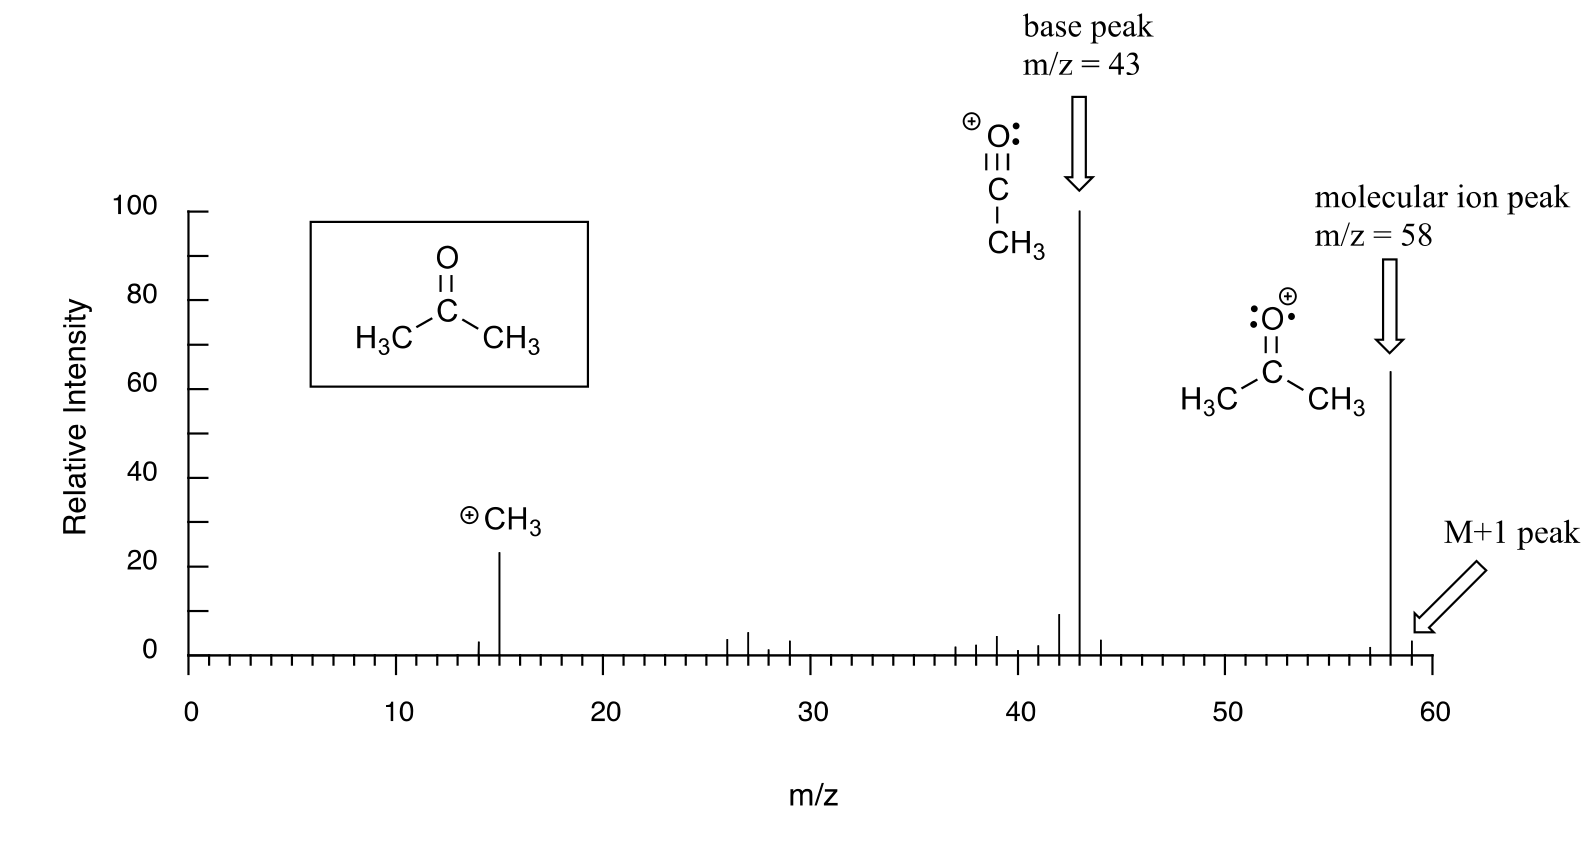
fig 27
The sample is acetone. On the horizontal axis is the value for m/z (as we stated above, the charge z is almost always +1, so in practice this is the same as mass). On the vertical axis is the relative abundance of each ion detected. On this scale, the most abundant ion, called the base peak, is set to 100%, and all other peaks are recorded relative to this value. In the acetone spectrum above, the base peak is at m/z = 43, representing a fragment of acetone with a mass of 43 amu. The molecular weight of acetone is 58, so we can identify the peak at m/z = 58 as that corresponding to the molecular ion peak, or parent peak. In some mass spectra, the molecular ion peak is the most abundant peak, and so it is also the base peak by definition.
The data collected in a mass spectrum - a series of m/z values, each associated with a relative abundance value - is a unique ‘fingerprint’ of the compound being analyzed, so the spectrum of an unknown sample can be used to search a computer database of MS spectra to come up with a ‘hit’, just as fingerprint information can be used by the police to identify a suspect from a fingerprint database. In fact, mass spectrometry is a powerful tool in criminal forensics.
An experienced chemist can gain a wealth of useful structural information from a mass spectrum, even without access to a reference database. The parent peak provides the molecular weight of the compound being analyzed, which of course is a very useful piece of information. However, much of the utility in electron-ionization MS comes from the fact that the radical cations generated in the electron-bombardment process tend to fragment in predictable ways. The base peak at m/z = 43 in the acetone spectrum, for example, is the result of the molecule breaking apart into what is termed an acylium cation and a methyl radical. The methyl radical fragment has a mass of 15 amu, but is not detected because it is neutral, not a cation.
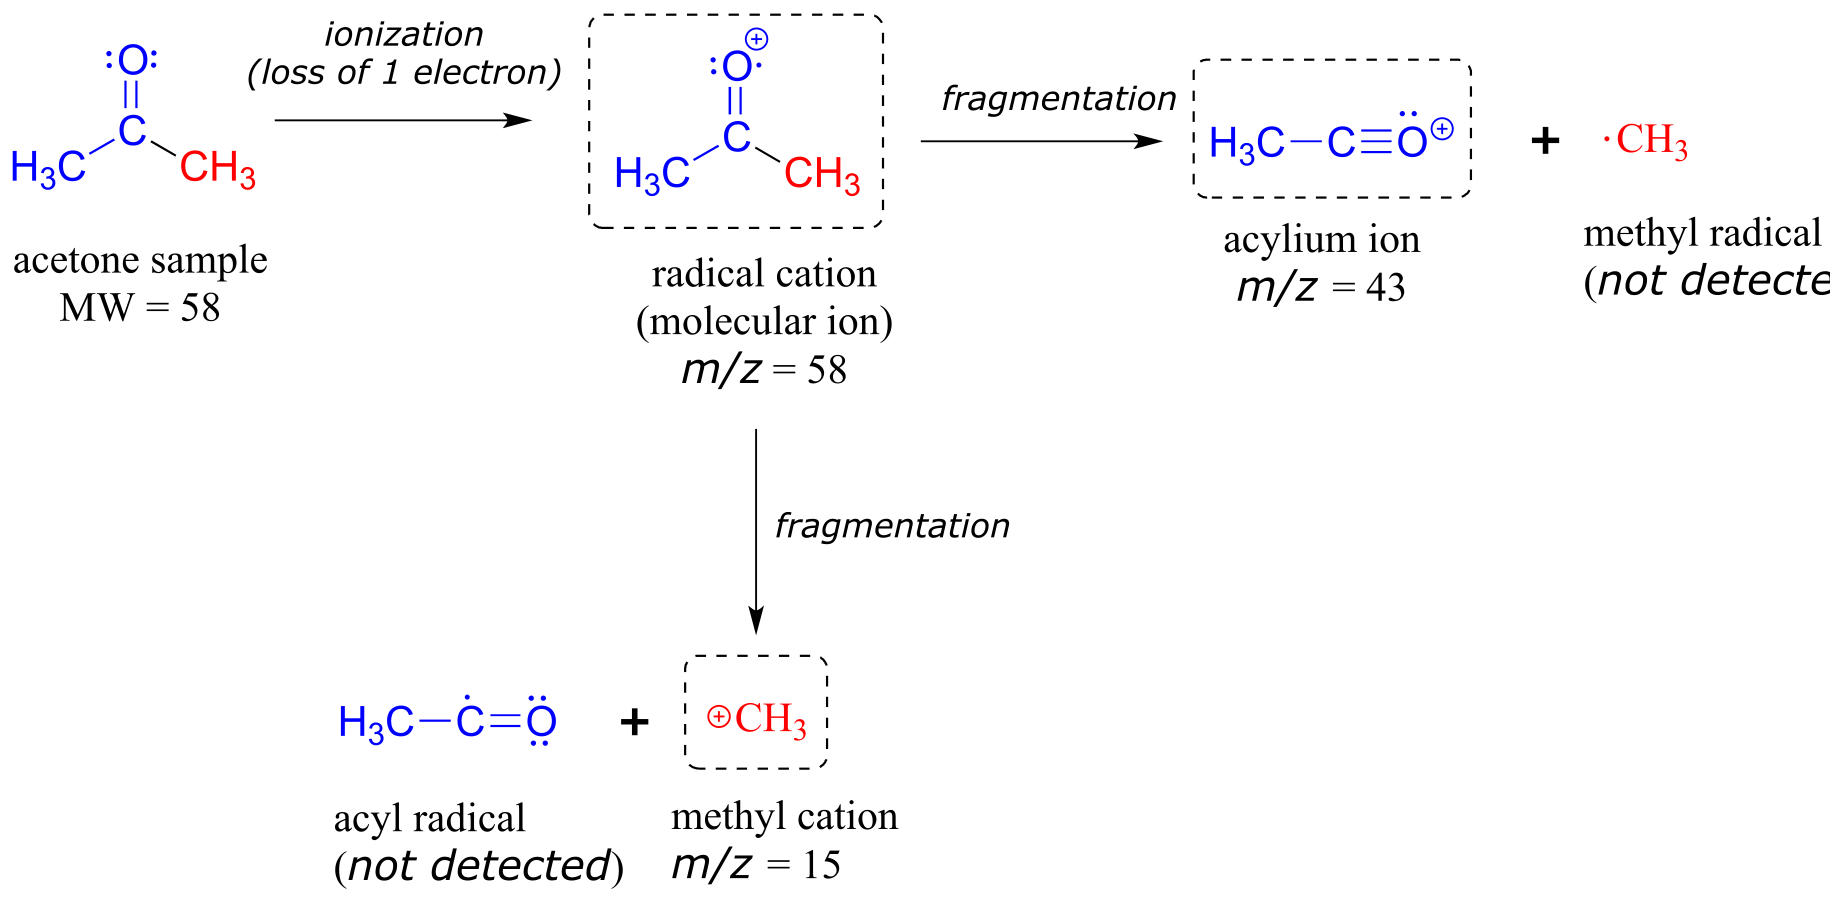
fig 29
Notice that we do in fact see a peak in the spectrum at m/z = 15, which corresponds to a methyl cation, formed in a different fragmentation event in which the second product is a neutral (and thus undetected) radical fragment.
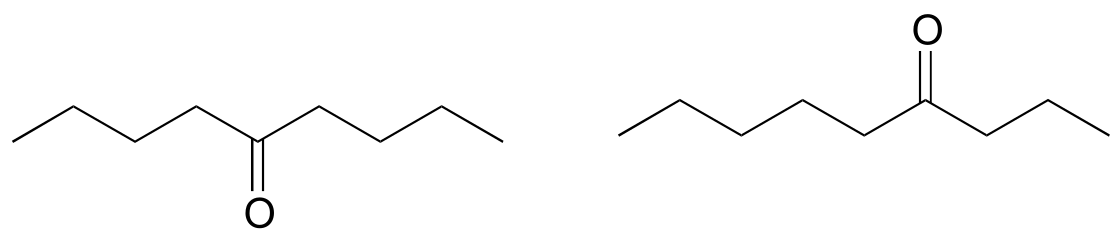
Exercise 4.1: Using the fragmentation patterns for acetone above as a guide, predict the signals that you would find in the mass spectra of:
a) 2-butanone; b) 3-hexanone; c) cyclopentanone.
Many other organic functional groups and bonding arrangements have predictable fragmentation patterns. As a rule, the cationic fragments that form in greatest abundance are those which are, relatively speaking, the most stable (we will learn about carbocation stability in chapter 8). A discussion of the mechanisms for fragmentation in mass spectrometry is outside the scope of this book, but will be covered if you take more advanced courses in organic or analytical chemistry.
Notice in the mass spectrum of acetone that there is a small peak at m/z = 59: this is referred to as the M+1 peak. How can there be an ion that has a greater mass than the molecular ion? A small fraction - about 1.1% - of all carbon atoms in nature are actually the 13C rather than the 12C isotope. The 13C isotope has an extra neutron in its nucleus, and thus is heavier than 12C by 1 mass unit. The M+1 peak corresponds to those few acetone molecules in the sample which contained a 13C.
Molecules with several oxygen atoms sometimes show a small M+2 peak (2 m/z units greater than the parent peak) in their mass spectra, due to the presence of a small amount of 18O (the most abundant isotope of oxygen is 16O). Because there are two abundant isotopes of both chlorine (about 75% 35Cl and 25% 37Cl) and bromine (about 50% 79Br and 50% 81Br), chlorinated and brominated compounds have very large and recognizable M+2 peaks. Fragments containing both isotopes of bromine can be seen in the mass spectrum of bromoethane: notice that the equal abundance of the two isotopes is reflected in the equal height of their corresponding peaks.
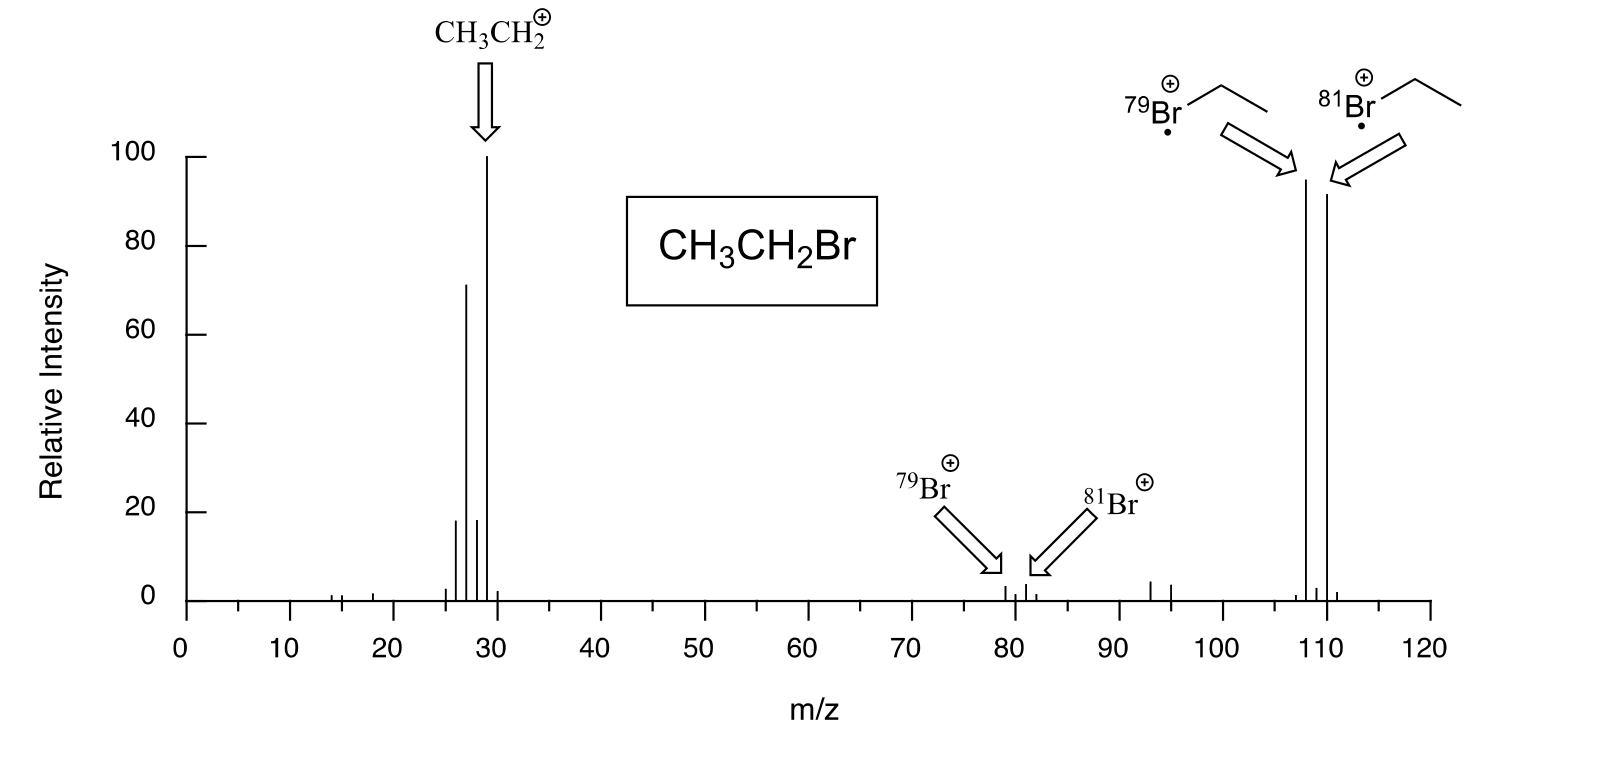
fig 28
The spectrum for chloroethane shows a parent peak at m/z = 64, and an M+2 peak at 1/3 the height of the parent peak. These characteristic M+2 patterns are useful for identifying the presence of bromine or chlorine in a sample.
Exercise 4.2: Predict some signals that you would expect to see in a mass spectrum of 2-chloropropane.
Exercise 4.3: The mass spectrum of an aldehyde shows a parent peak at m/z = 58 and a base peak at m/z = 29. Propose a structure, and identify the two species whose m/z values were listed. (
4.1C: Gas Chromatography - Mass Spectrometry#
Quite often, mass spectrometry is used in conjunction with a separation technique called gas chromatography (GC). The combined GC-MS procedure is very useful when dealing with a sample that is a mixture of two or more different compounds, because the various compounds are separated from one another before being subjected individually to MS analysis. We will not go into the details of gas chromatography here, although if you are taking an organic laboratory course you might well get a chance to try your hand at GC, and you will almost certainly be exposed to the conceptually analogous techniques of thin layer and column chromatography. Suffice it to say that in GC, a very small amount of a liquid sample is vaporized, injected into a long, coiled capillary column, and pushed though the column by an inert gas, usually helium. Along the way, different compounds in the sample stick to the walls of the capillary column to different extents, and thus travel at different speeds and emerge separately from the end of the column. In GC-MS, each separated compound is sent directly from the end of the GC column into the MS instrument, so in the end we get a separate mass spectrum for each of the components in the original mixed sample.
Schematic of a GC-MS instrument
Ideally, this data can be used to search an MS database and identify each compound in the sample.
The extremely high sensitivity of modern GC-MS instrumentation makes it possible to detect and identify very small trace amounts of organic compounds. GC-MS is being used increasingly by environmental chemists to detect the presence of harmful organic contaminants in food and water samples.
4.1D: Mass spectrometry of biomolecules#
Methods Enzymol. 2005, 402, 3.
As was mentioned earlier, electron ionization mass spectrometry is generally not very useful for analyzing biomolecules: their high polarity makes it difficult to get them into the vapor phase, the first step in EIMS. Mass spectrometry of biomolecules has undergone a revolution over the past few decades, with many new ionization and separation techniques being developed. Generally, the strategy for biomolecule analysis involves soft ionization, in which much less energy (compared to techniques such as EIMS) is imparted to the molecule being analyzed during the ionization process. Usually, soft ionization involves adding protons rather than removing electrons: the cations formed in this way are significantly less energetic than the radical cations formed by removal of an electron. The result of soft ionization is that little or no fragmentation occurs, so the mass being measured is that of an intact molecule. Typically, large biomolecules are digested into smaller pieces using chemical or enzymatic methods, then their masses determined by ‘soft’ MS.
New developments in soft ionization MS technology have made it easier to detect and identify proteins that are present in very small quantities in biological samples. In electrospray ionization (ESI), the protein sample, in solution, is sprayed into a tube and the molecules are induced by an electric field to pick up extra protons from the solvent. Another common ‘soft ionization’ method is ‘matrix-assisted laser desorption ionization’ (MALDI). Here, the protein sample is adsorbed onto a solid matrix, and protonation is achieved with a laser.
Typically, both electrospray ionization and MALDI are used in conjunction with a time-of-flight (TOF) mass analyzer component.
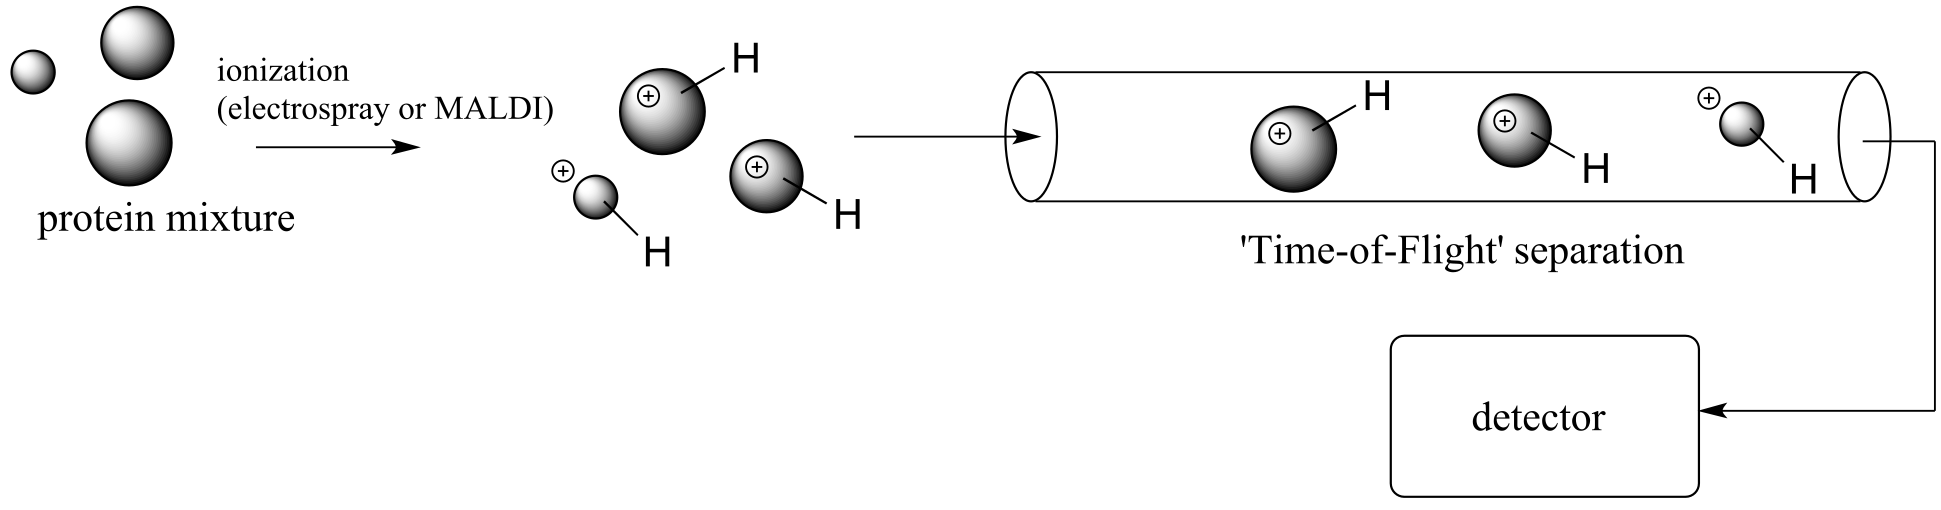
fig 30
another schematic of MALDI-TOF
The proteins are accelerated by an electrode through a column, and separation is achieved because lighter ions travel at greater velocity than heavier ions with the same overall charge. In this way, the many proteins in a complex biological sample (such as blood plasma, urine, etc.) can be separated and their individual masses determined very accurately. Modern protein MS is extremely sensitive – recently, scientists were even able to detect the presence of Tyrannosaurus rex protein in a fossilized skeleton! (Science 2007, 316, 277).
Soft ionization mass spectrometry has become in recent years an increasingly important tool in the field of proteomics. Traditionally, protein biochemists tend to study the structure and function of individual proteins. Proteomics researchers, in contrast, want to learn more about how large numbers of proteins in a living system interact with each other, and how they respond to changes in the state of the organism. One important subfield of proteomics is the search for protein ‘biomarkers’ for human disease: in other words, proteins which are present in greater quantities in the tissues of a sick person than in a healthy person. Detection in a healthy person of a known biomarker for a disease such as diabetes or cancer could provide doctors with an early warning that the patient may be especially susceptible to the disease, so that preventive measures could be taken to prevent or delay onset.
In a 2005 study, MALDI-TOF mass spectrometry was used to compare fluid samples from lung transplant recipients who had suffered from tissue rejection to samples from recipients who had not suffered rejection. Three peptides (short proteins) were found to be present at elevated levels specifically in the tissue rejection samples. It is hoped that these peptides might serve as biomarkers to identify patients who are at increased risk of rejecting their transplanted lungs. (Proteomics 2005, 5, 1705). More recently, MALDI-TOF MS was used to identify protein biomarkers for Alzheimer’s disease in the blood, which could lead to an early diagnosis method for Alzheimer’s which is much less expensive than brain scans, the only detection method currently available (Nature 2018, 554, 249).
4.2: Introduction to molecular spectroscopy#
4.2A: The electromagnetic spectrum#
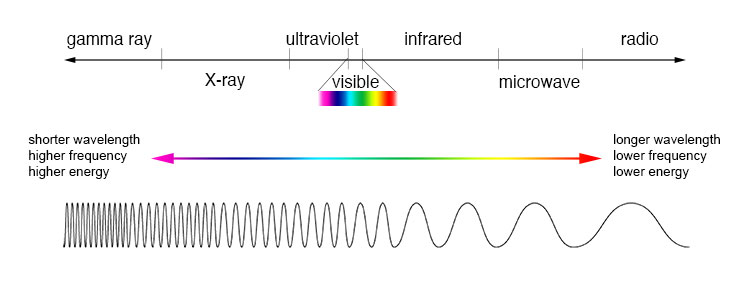
Electromagnetic radiation, as you may recall from a previous chemistry or physics class, is composed of oscillating electrical and magnetic fields. Visible light is electromagnetic radiation. So are the gamma rays that are emitted by spent nuclear fuel, the x-rays that a doctor uses to visualize your bones, the ultraviolet light that causes a painful sunburn when you forget to apply sun block, the infrared light that the army uses in night-vision goggles, the microwaves you use to heat up your frozen burritos, and the radio-frequency waves of your cell phone signal.
While the speed of a wave in the ocean can vary, the speed of electromagnetic waves – commonly referred to as the speed of light – is a constant, approximately 300 million meters per second, whether we are talking about gamma radiation, visible light, or FM radio waves. Electromagnetic radiation is defined by its wavelength, which is the distance between one wave crest to the next.
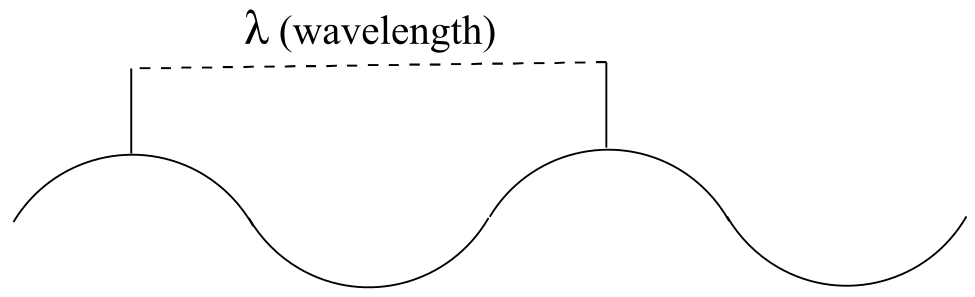
Because electromagnetic radiation travels at a constant speed, each wavelength corresponds to a given frequency, which is the number of times per second that a crest passes a given point. Longer waves have lower frequencies, and shorter waves have higher frequencies. Frequency is commonly reported in hertz (Hz), meaning ‘cycles per second’, or ‘waves per second’. The equivalent standard unit for frequency is s-1.
When talking about electromagnetic waves, we can refer either to wavelength or to frequency - the two values are inversely proportional:
equation 4.1 λυ = c
where λ (Greek ‘lambda’) is wavelength, υ (Greek ‘nu’) is frequency in s-1 (or Hz), and c is the speed of light, a constant value of 3.0 x 10⁸ m·s-1.
Electromagnetic radiation transmits energy in discreet quantum ‘packages’ called photons. Shorter wavelengths (and higher frequencies) correspond to higher energy.
High energy radiation, such as gamma radiation and x-rays, is composed of very short waves – as short as 10-16 m. Longer wavelengths are far less energetic, and thus are less dangerous to living things. Visible light waves are in the range of 400 – 700 nm (nanometers, or 10-9 m), while radio waves can be several hundred meters in length.
The energy of a particular wavelength of electromagnetic radiation can be expressed as:
equation 4.2 E = hc/λ = hν
where E is energy in kJ/mol of photons and h is 3.99 x 10⁻¹³ kJ·s·mol-1, a number known as Planck’s constant.
Using equations 4.1 and 4.2, we can calculate, for example, that visible red light with a wavelength of 700 nm has a frequency of 4.29 x 10¹⁴ Hz, and an energy of 171 kJ per mole of photons.
The full range of electromagnetic radiation wavelengths is referred to as the electromagnetic spectrum.
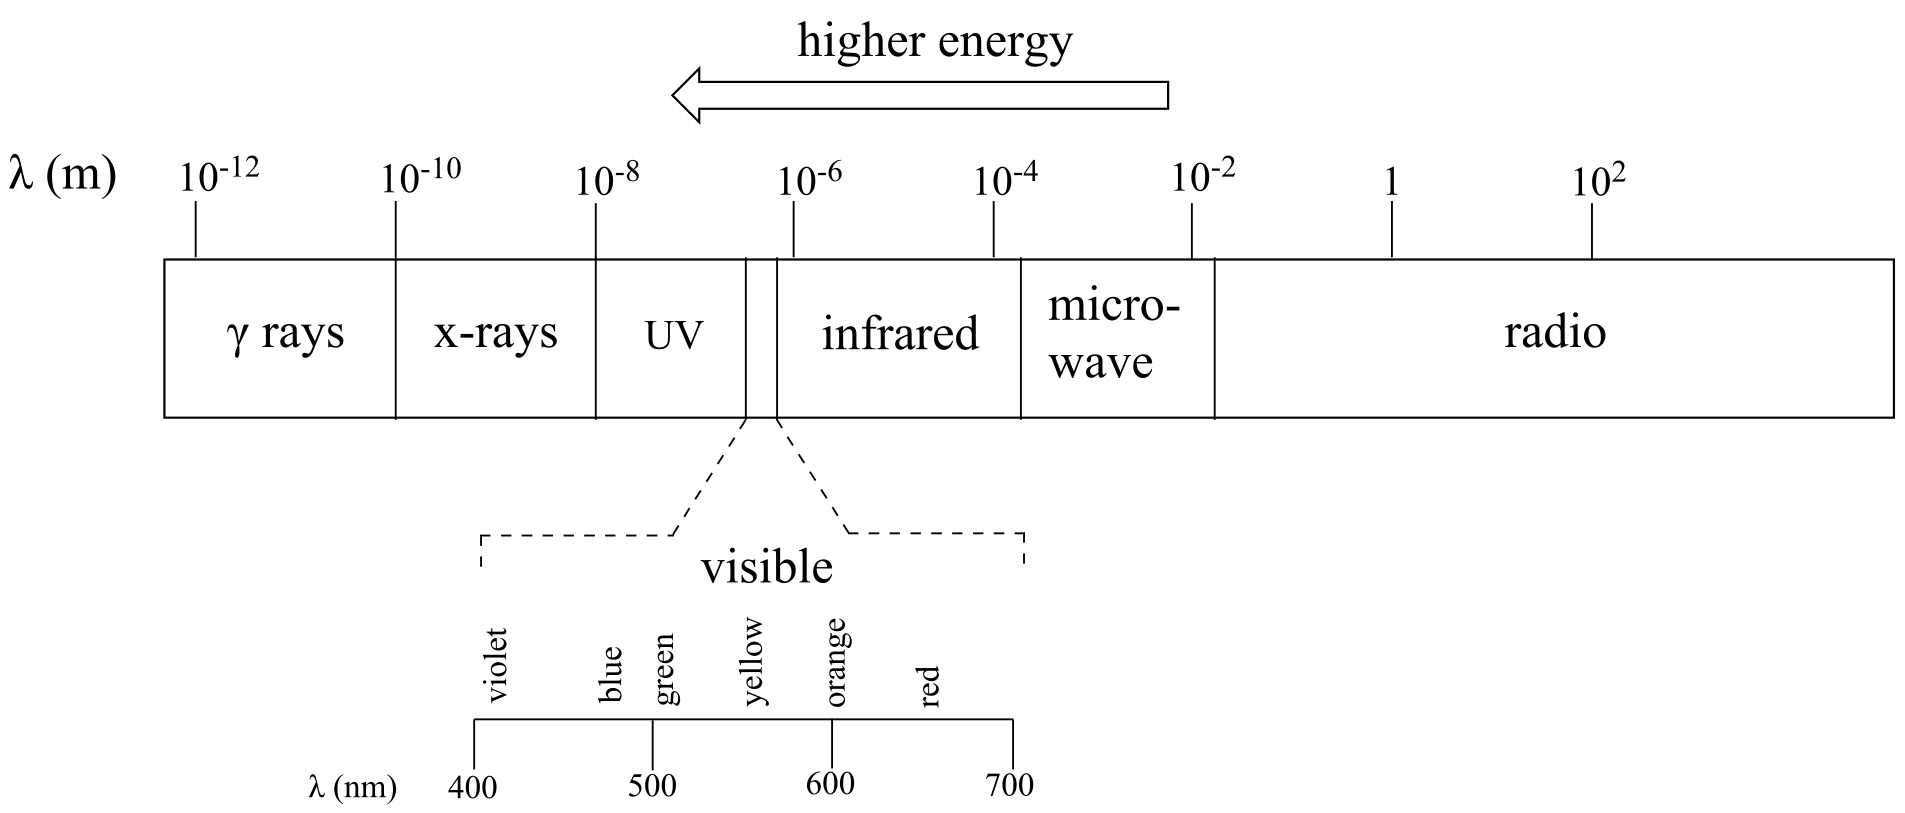
fig 1
Notice in the figure above that visible light takes up just a narrow band of the full spectrum. White light from the sun or a light bulb is a mixture of all of the visible wavelengths plus some UV. You see the visible region of the electromagnetic spectrum divided into its different wavelengths every time you see a rainbow: violet light has the shortest wavelength, and red light has the longest.
Exercise 4.4: Visible light has a wavelength range of about 400-700 nm. What is the corresponding frequency range? What is the corresponding energy range, in kJ/mol of photons?
4.2B: Overview of the molecular spectroscopy experiment#
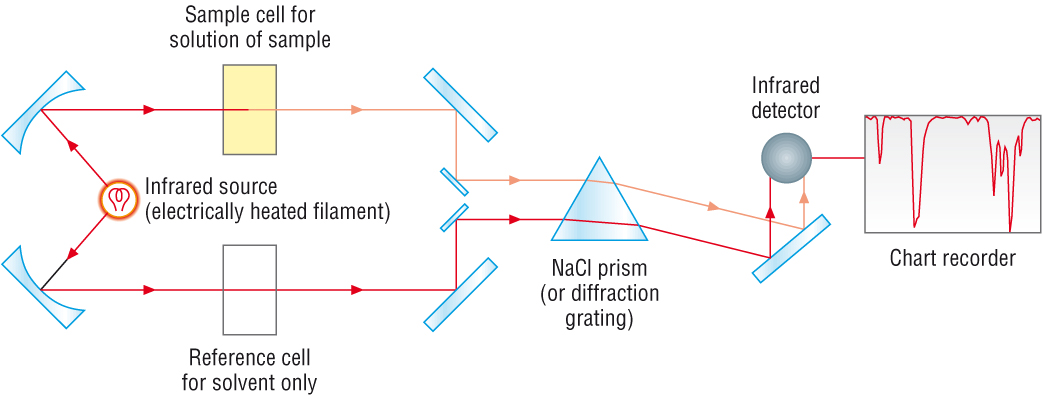
In a molecular spectroscopy experiment, electromagnetic radiation of a specified range of wavelengths is allowed to pass through a sample containing a compound of interest. The sample molecules absorb energy from some of the wavelengths, and as a result jump from a low energy ‘ground state’ to some higher energy ‘excited state’. Other wavelengths are not absorbed by the sample molecule, so they pass on through. A detector records which wavelengths were absorbed, and to what extent they were absorbed.
General schematic of molecular spectroscopy
As we will see in this chapter, we can learn a lot about the structure of an organic molecule by quantifying how it absorbs (or does not absorb) different wavelengths in the electromagnetic spectrum. Three of the most useful types of molecular spectroscopy for organic chemists involve absorption of radiation in the infrared, ultraviolet/visible, and radio regions of the electromagnetic spectrum. We will focus first on infrared spectroscopy.
4.3: Infrared spectroscopy#
Covalent bonds in organic molecules are not rigid sticks – rather, they behave more like springs. At room temperature, organic molecules are always in motion, as their bonds stretch, bend, and twist. These complex vibrations can be broken down mathematically into individual vibrational modes, a few of which are illustrated below.
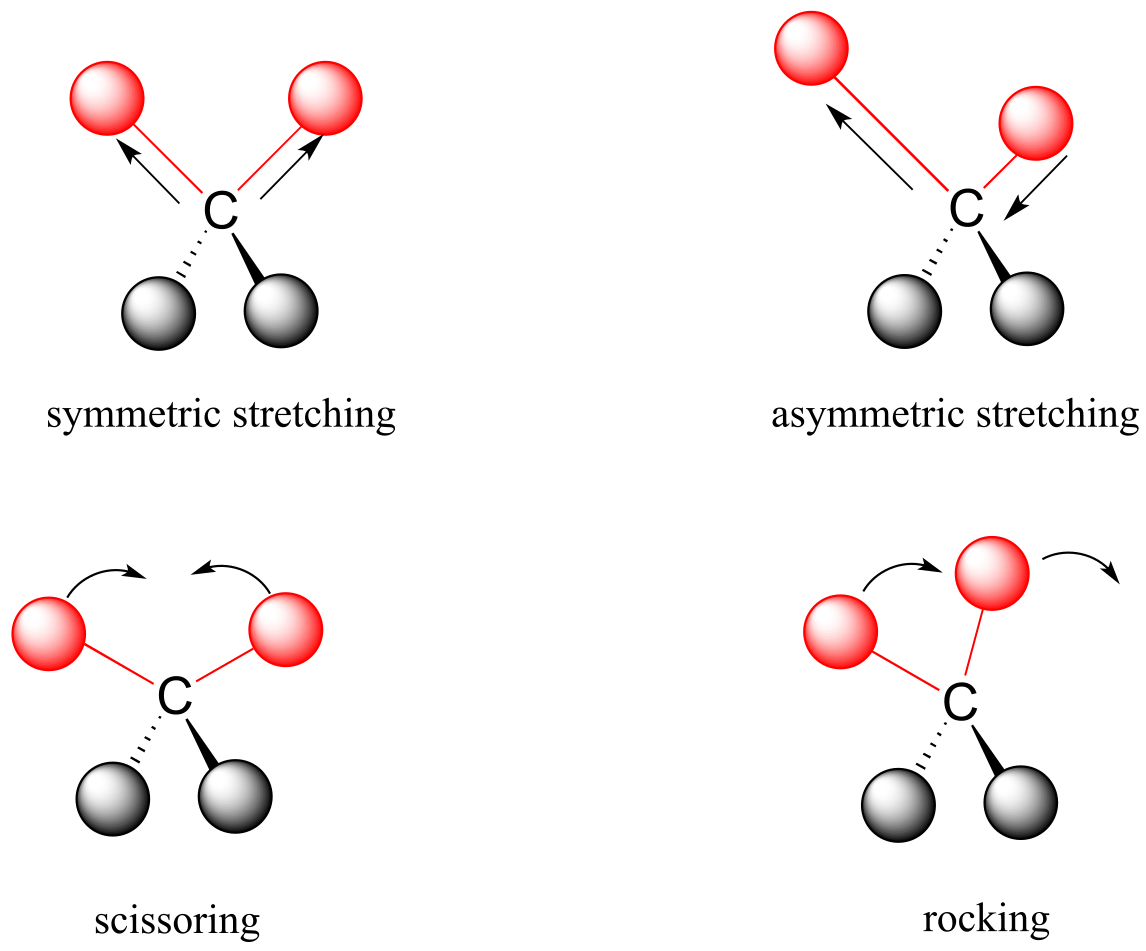
fig 3
interactive: vibrational modes of water
Each vibrational mode for any bond in an organic molecule has a characteristic ground state frequency of vibration, which will be somewhere between 1013 and 1014 vibrations per second. This range of frequencies corresponds to the infrared region of the electromagnetic spectrum.
If a molecule is exposed to electromagnetic radiation that matches the frequency of one of its vibrational modes, it will absorb energy from the radiation and jump to a higher vibrational energy state - the amplitude of the vibration will increase, but the vibrational frequency will remain the same. The difference in energy between the two vibrational states is equal to the energy associated with the wavelength of radiation that was absorbed.
Let’s take 2-hexanone as an example. Picture the carbonyl bond of the ketone group as a spring. This spring is constantly bouncing back and forth, stretching and compressing, pushing the carbon and oxygen atoms further apart and then pulling them together. This is the stretching mode of the carbonyl bond. In the space of one second, the spring ‘bounces’ back and forth 5.15 x 10¹³ times - in other words, its stretching frequency is 5.15 x 10¹³ Hz (remember that Hz means ‘per second’).
animation of carbonyl stretching in several organic molecules
If our ketone sample is irradiated with infrared light, the carbonyl bond will absorb light of a frequency matching its stretching frequency of 5.15 x 10¹³ Hz, which by equations 4.1 and 4.2 corresponds to a wavelength of λ = 5.83 x 10⁻⁶ m and an energy of 20.5 kJ/mol. When the carbonyl bond absorbs this energy, it jumps up to its excited vibrational state.
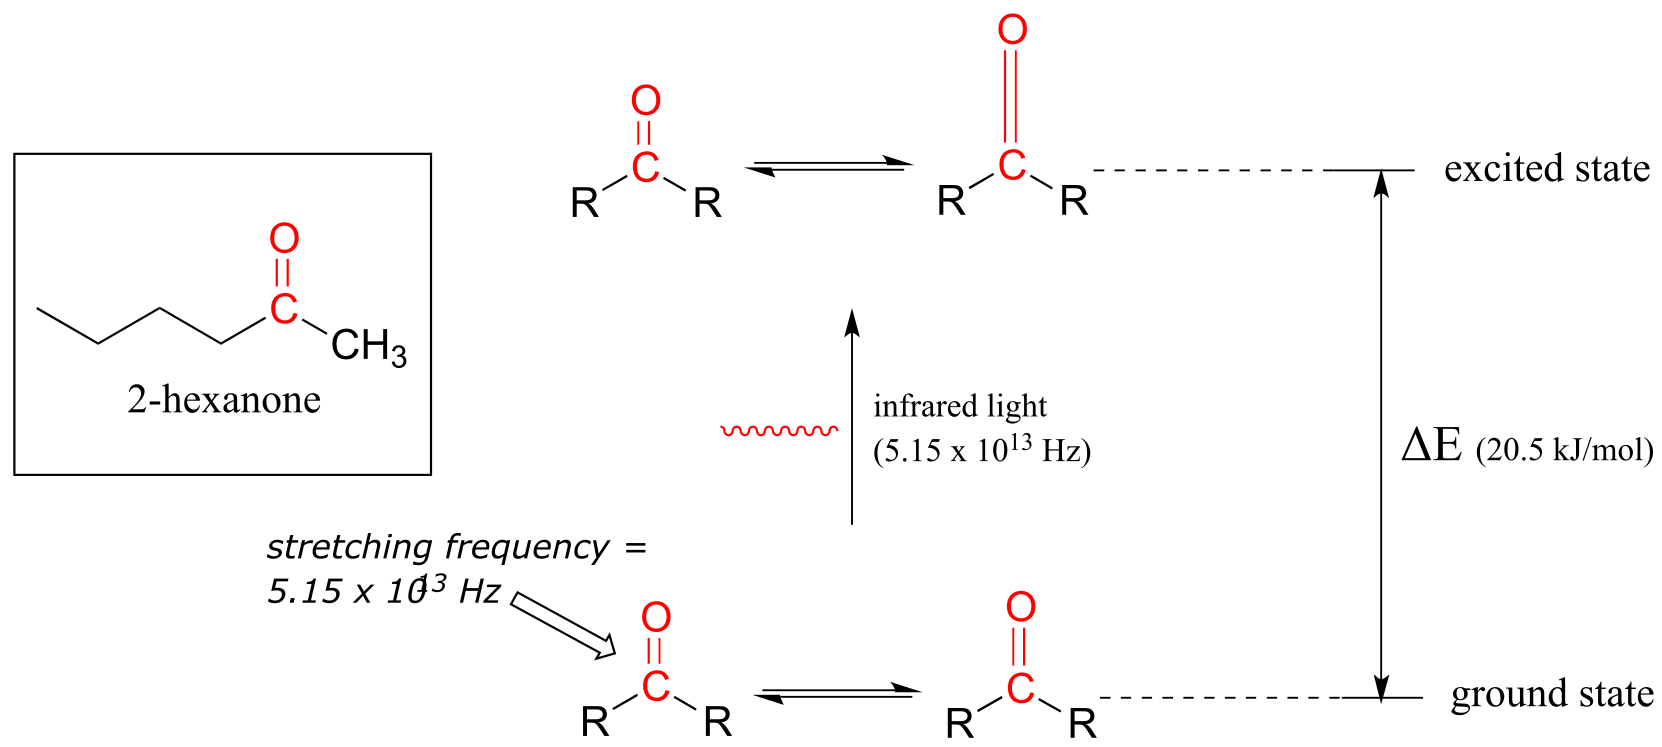
fig 4
The molecule does not remain in the excited vibrational state for very long, but quickly releases energy to the surrounding environment in form of heat, and returns to the ground state.
In an infrared spectrophotometer, light in the infrared region (frequencies ranging from about 1013 to 1014 Hz) is passed though our sample of 2-hexanone. Most frequencies pass right through the sample. The 5.15 x 10¹³ Hz carbonyl stretching frequency, however, is absorbed by the 2-hexanone sample, and a detector in the instrument records that the intensity of this frequency, after having passed through the sample, is something less than 100% of its initial value.
The vibrations of a 2-hexanone molecule are not, of course, limited to the simple stretching of the carbonyl bond. The various carbon-carbon bonds also stretch and bend, as do the carbon-hydrogen bonds, and all of these vibrational modes also absorb different frequencies of infrared light.
The power of infrared spectroscopy arises from the observation that the bonds characterizing different functional groups have different characteristic absorption frequencies. The carbonyl bond in a ketone, as we saw with our 2-hexanone example, typically absorbs in the range of 5.11 - 5.18 x 10¹³ Hz, depending on the molecule. The carbon-carbon triple bond of an alkyne, on the other hand, absorbs in the range of 6.30 - 6.80 x 10¹³ Hz. The technique is therefore very useful as a means of identifying which functional groups are present in a molecule of interest. If we pass infrared light through an unknown sample and find that it absorbs in the carbonyl frequency range but not in the alkyne range, we can infer that the molecule contains a carbonyl group but not an alkyne.
Some bonds absorb infrared light more strongly than others, and some bonds do not absorb at all. In order for a vibrational mode to absorb infrared light, it must result in a periodic (repeating) change in the dipole moment of the molecule. Such vibrations are said to be infrared active. In general, the greater the polarity of the bond, the stronger its IR absorption. The carbonyl bond is very polar, and therefore absorbs very strongly. The carbon-carbon triple bond in most alkynes, in contrast, is much less polar, and thus a stretching vibration does not result in a large change in the overall dipole moment of the molecule. We will see below that IR signals for carbonyl bonds are very strong, but the signals for carbon-carbon double and triple bonds are relatively weak.
Some kinds of vibrations are infrared inactive. The stretching vibrations of completely symmetrical double and triple bonds, for example, do not result in a change in dipole moment, and therefore do not result in any absorption of light (but other bonds and vibrational modes in these molecules do absorb IR light).
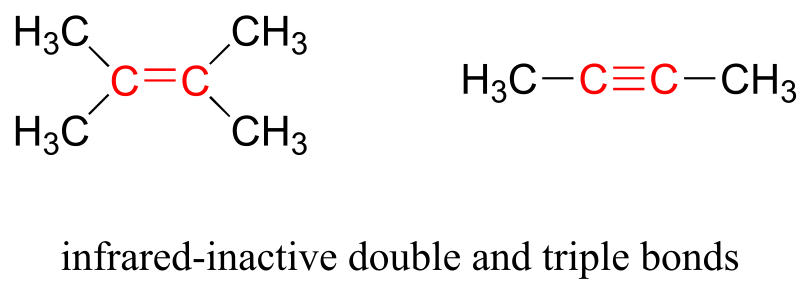
fig 6
Now, let’s look at some actual output from IR spectroscopy experiments. Below is the IR spectrum for 2-hexanone.

fig 7
There are a number of things that need to be explained in order for you to understand what it is that we are looking at. On the horizontal axis we see IR wavelengths expressed in terms of a unit called wavenumber (cm-1), which tells us how many waves fit into one centimeter.
equation 4.3: wavenumber (in cm-1) = 1/100λ ν/100c
where λ is the wavelength in meters, v is frequency in s-1, and c is the speed of light, 3.0 x 10⁸ m/s. Wavenumber units are typically used in IR spectra, but you may also occasionally see micrometer (μm) units) on the horizontal axis.
On the vertical axis we see ‘% transmittance’, which tells us how strongly light was absorbed at each frequency (100% transmittance, at the high end of the axis, means no absorption occurred at that frequency). The solid line traces the values of % transmittance for every wavelength passed through the sample – the downward-pointing absorbance bands show regions of strong absorption.
Exercise 4.5: Express the wavenumber value of 3000 cm-1 in terms of wavelength (in meter units) frequency (in Hz), and associated energy (in kJ/mol).
The key absorption band in this spectrum is that from the carbonyl double bond, at
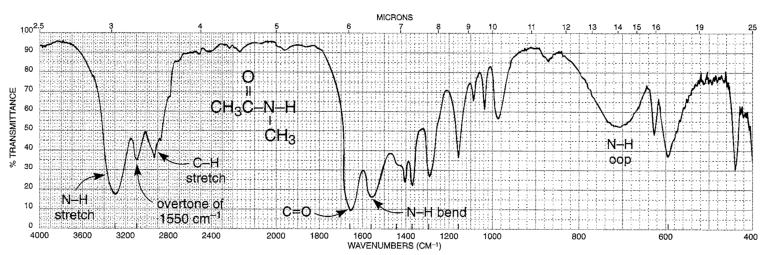
1716 cm-1, corresponding to a wavelength of 5.86 μm, a frequency of 5.15 x 10¹³ Hz, and a ∆E value of 20.5 kJ/mol. Notice how strong this band is, relative to the others on the spectrum: a strong absorbance band in the 1650-1750 cm-1 region tells us that a carbonyl group is present. Within that range, carboxylic acids, esters, ketones, and aldehydes tend to absorb in the shorter wavelength end (1700-1750 cm-1), while conjugated unsaturated ketones and amides tend to absorb on the longer wavelength end (1650-1700 cm-1).
The jagged band at approximately 2900-3000 cm-1 is characteristic of the stretching modes of sp3-hybridized carbon-hydrogen bonds. This band is not terribly useful, as just about every organic molecule that you will have occasion to analyze has these bonds. Nevertheless, it can serve as a familiar reference point to orient yourself in a spectrum.
You will notice that there are many additional band in this spectrum in the longer-wavelength 400 -1400 cm-1 region. This part of the spectrum is called the fingerprint region. While it is usually very difficult to pick out anything specific to a functional group from this region, the fingerprint region nevertheless contains valuable information. Just like a human fingerprint, the pattern of absorbance bands in the fingerprint region is unique to every molecule, meaning that the data from an unknown sample can be compared to a database of IR spectra of known standards in order to make a positive identification. In our introductory story about the forged paintings, it was the IR fingerprint region of the suspicious yellow paint that allowed for its identification as a pigment that could not possibly have been used by the purported artist, William Aiken Walker. (Recall from earlier in this chapter that a mass spectrum of a molecule can also be thought of as a kind of ‘fingerprint’ by which the molecule can be identified.)
Now, let’s take a look at the IR spectrum for 1-hexanol.

fig 8
As expected, there is no carbonyl band at around 1700 cm-1, but we can see a very broad ‘mountain’ centered at about 3400 cm-1. This signal is characteristic of the O-H stretching mode of alcohols, and tells us that our sample has an alcohol group. The breadth of this signal is a consequence of hydrogen bonding between molecules.
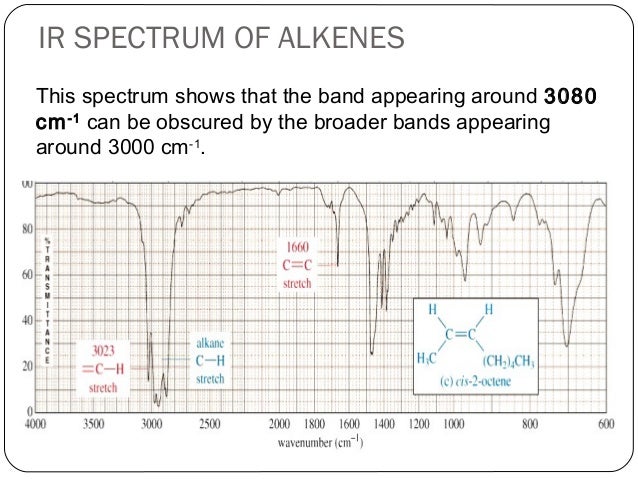
The spectrum for 1-octene shows two bands that are characteristic of alkenes: the one at 1642 cm-1 is due to stretching of the carbon-carbon double bond, and the one at 3079 cm-1 is due to stretching of the σ bond between the sp2-hybridized alkene carbons and their attached hydrogens.

fig 10
Alkynes have characteristic weak but sharp IR absorbance bands in the range of 2100-2250 cm-1 due to stretching of the carbon-carbon triple bond, and terminal alkynes can be identified by their absorbance at about 3300 cm-1, due to stretching of the bond between the sp-hybridized carbon and the terminal hydrogen.)
Exercise 4.6: Explain how you could use the C-C and C-H stretching frequencies in IR spectra to distinguish between four constitutional isomers: 1,2-dimethylcyclohexene, 1,3-octadiene, 3-octyne, and 1-octyne.
Other functional groups can be identified IR, but we will confine our discussion here to a small set of the most easily identifiable groups. These are summarized below.
Characteristic IR absorbances
Functional group |
Characteristic IR absorbance(s) (cm-1) |
Source of signal |
|---|---|---|
carbonyl |
1650-1750 (strong) |
C=O stretching |
alcohol |
3200 - 3600 (broad) |
O-H stretching |
carboxylic acid |
1700-1725 (strong) |
C=O stretching |
2500-3000 (broad) |
O-H stretching |
|
alkene |
1620 - 1680 (weak) |
C=C stretching |
3020 - 3080 |
vinylic C-H stretching |
|
alkyne |
1620 - 1680 (weak) |
triple bond stretching |
3250-3350 |
terminal C-H stretching |
A more detailed summary is provided here and in Table 1 at the end of this book.
An IR spectrum usually does not provide enough information for us to figure out the complete structure of a molecule. In conjunction with other analytical methods, however, IR spectroscopy can prove to be a very valuable tool, given the information it provides about the presence or absence of key functional groups. IR can also be a quick and convenient way for a chemist to check to see if a reaction has proceeded as planned. If we were to run a reaction in which we wished to convert cyclohexanone to cyclohexanol, for example, a quick comparison of the IR spectra of starting compound and product would tell us if we had successfully converted the ketone group to an alcohol.
IR spectrum of a carboxylic acid (propionic acid)
IR spectrum of an amide (N-methylaceetamide)
Exercise 4.7: Using the online Spectral Database for Organic Compounds, look up IR spectra for the following compounds, and identify absorbance bands corresponding to those listed in the table above. List actual frequencies for each signal to the nearest cm-1 unit, using the information in tables provided on the site.
a) 1-methylcyclohexanol
b) 4-methylcyclohexene
c) 1-hexyne
d) 2-hexyne
e) 3-hexyne-2,5-diol
Exercise 4.8: A carbon-carbon single bond absorbs in the fingerprint region, and we have already seen the characteristic absorption wavelengths of carbon-carbon double and triple bonds. Rationalize the trend in wavelengths. (Hint - remember, we are thinking of bonds as springs, and looking at the frequency at which they ‘bounce’).
4.4: Ultraviolet and visible spectroscopy#
Ultraviolet and visible (UV-Vis) spectroscopy provides us with information about aromatic groups and other conjugated π systems in organic compounds. In looking at IR spectroscopy, we saw how interaction with infrared light causes molecules to undergo vibrational transitions. The shorter wavelength, higher energy radiation in the UV (200-400 nm) and visible (400-700 nm) range of the electromagnetic spectrum causes organic molecules with conjugated π bonds to undergo electronic transitions.
4.4A: The electronic transition#
Recall from chapter 2 that molecular orbital (MO) theory can be a useful way to think about covalent bonding in molecules containing conjugated double bonds and aromatic rings. Keep in mind that molecular orbitals result from the mathematical combination of two or more atomic orbitals, and describe a region in space around a group of atoms (rather than a single atom) in which electrons are likely to be found. We’ll see here that MO theory is indispensible to a discussion of ultraviolet and visible spectroscopy.
A chromophore is any molecule or part of a molecule that has the property of absorbing light in the ultraviolet or visible region of the spectrum. 1,3-butadiene is a chromophore. Recall from section 2.2B that the conjugated π bonds in1,3-butadiene can be pictured as four parallel, overlapping p orbitals sharing four electrons:
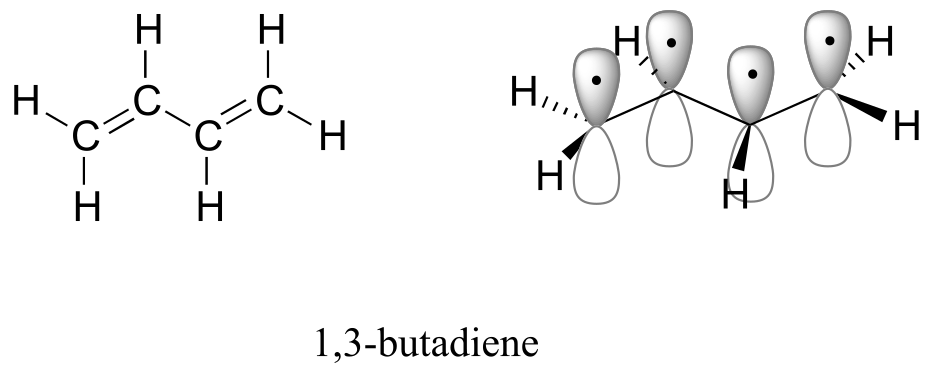
fig 11
Using the language of MO theory, we can say that the four p atomic orbitals combine to form four π molecular orbitals. The two lower energy orbitals π1 and π2 are bonding orbitals, while the two higher energy orbitals π3* and π4* are antibonding orbitals.
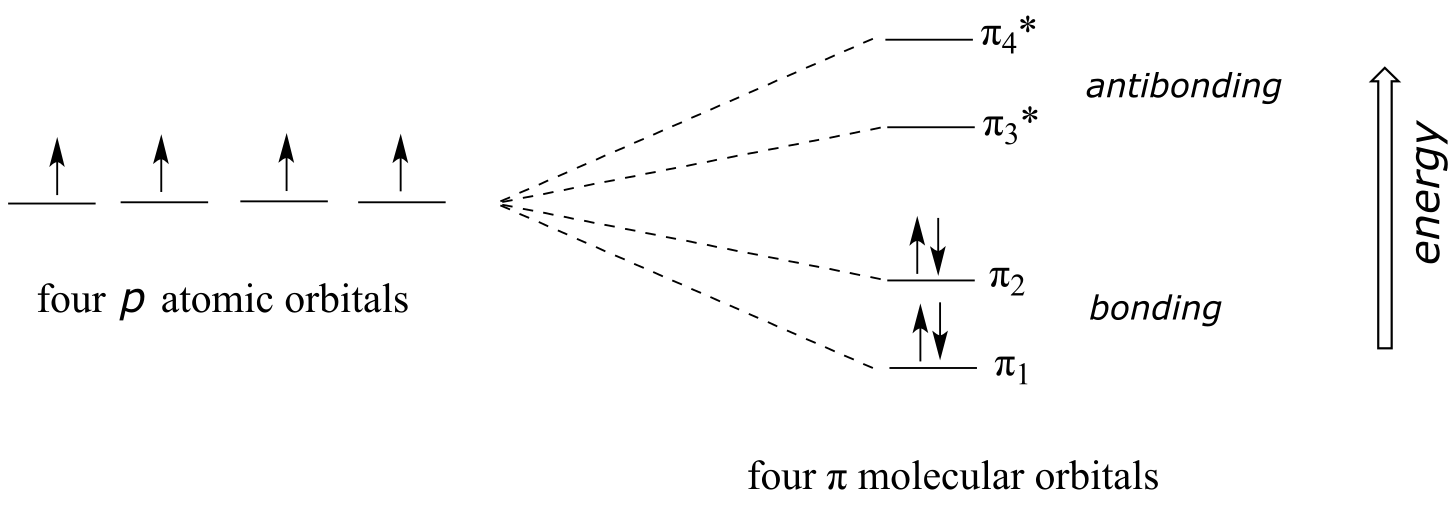
fig 12
In the electronic ground state, all four π electrons in the conjugated system reside in the two bonding orbitals. A **π **→ π* transition occurs when an electron in π2, the highest occupied molecular orbital (HOMO) jumps up to π3*, the lowest unoccupied molecular orbital (LUMO). The gap between these two molecule orbitals is often called the HOMO-LUMO energy gap.
For 1,3-butadiene, the energy difference in the HOMO-LUMO gap is 552 kJ/mol. This energy corresponds to light with a wavelength of 217 nm, which is in the ultraviolet region of the spectrum. When a sample of 1,3-butadiene is irradiated with UV radiation, the molecule absorbs the light at 217 nm as an electron undergoes a π-π* transition.
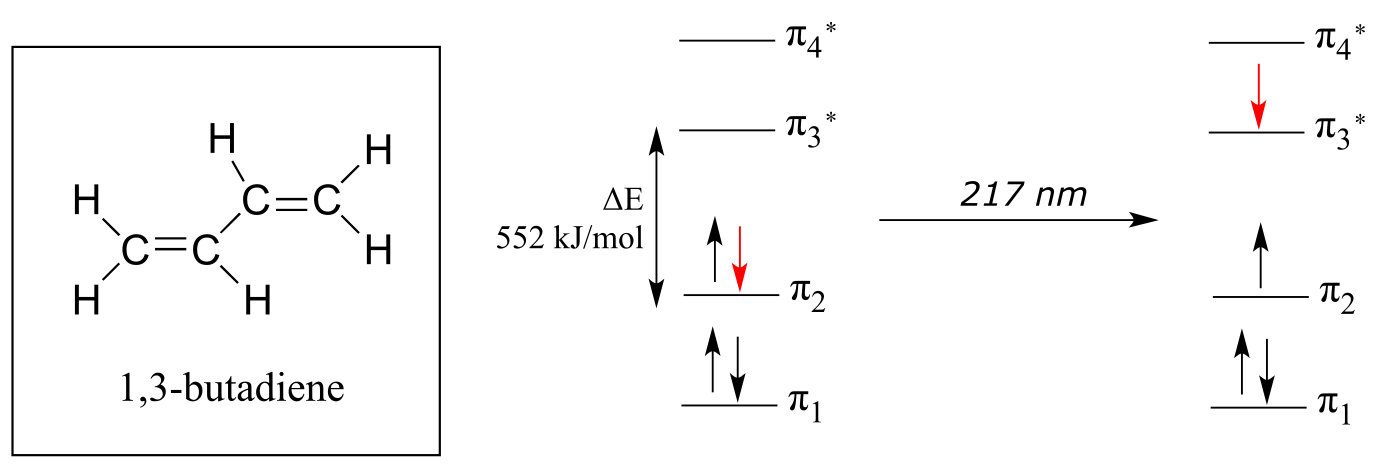
fig 13
The absorbance due to the π → π* transition in 1,3,5-hexatriene occurs at 258 nm, corresponding to a HOMO-LUMO gap of 464 kJ/mol.
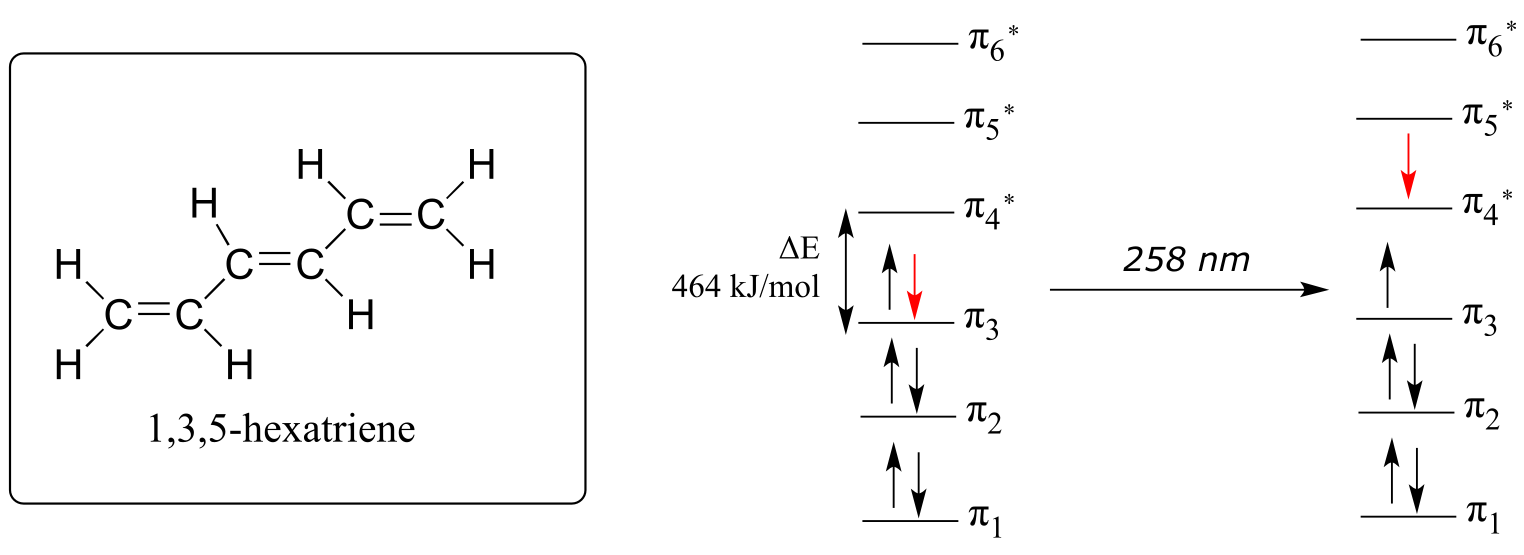
fig 14
Notice what happened here: when the conjugated π system was extended by two carbons, the HOMO-LUMO energy gap shrunk from 552 to 464 kJ/mol. A lower energy transition corresponds to longer wavelength absorbance (look again at equation 4.2 in the previous section). In general:
As conjugated π systems become more extended,
a) the HOMO-LUMO gap shrinks, and
b) the wavelength of absorbed light becomes longer.
In molecules with very large, extended conjugated π systems, the π → π* energy gap becomes so small that absorption occurs in the visible rather than the UV region of the electromagnetic spectrum.
The visible region of the electromagnetic spectrum:
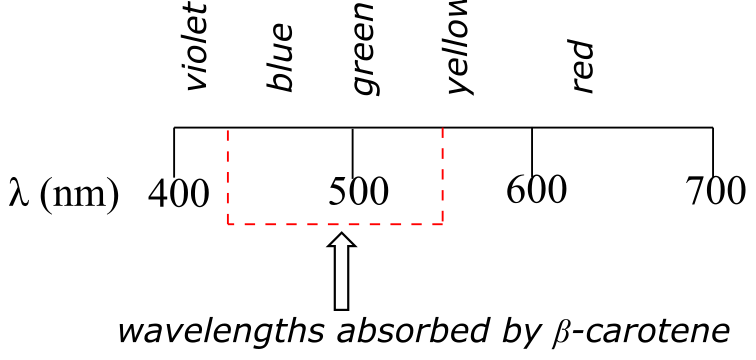
fig 14a
β-carotene, with its system of 11 conjugated double bonds, absorbs light in a broad band between approximately 420-550 nm, with a λmax at 470 nm, spanning the blue and green regions of the visible spectrum. Because blue/green wavelengths are absorbed while those in the red and yellow regions are able to pass through the sample, β-carotene appears to our eyes as orange. β-carotene is abundant in carrots, and is the compound mainly responsible for their orange color.
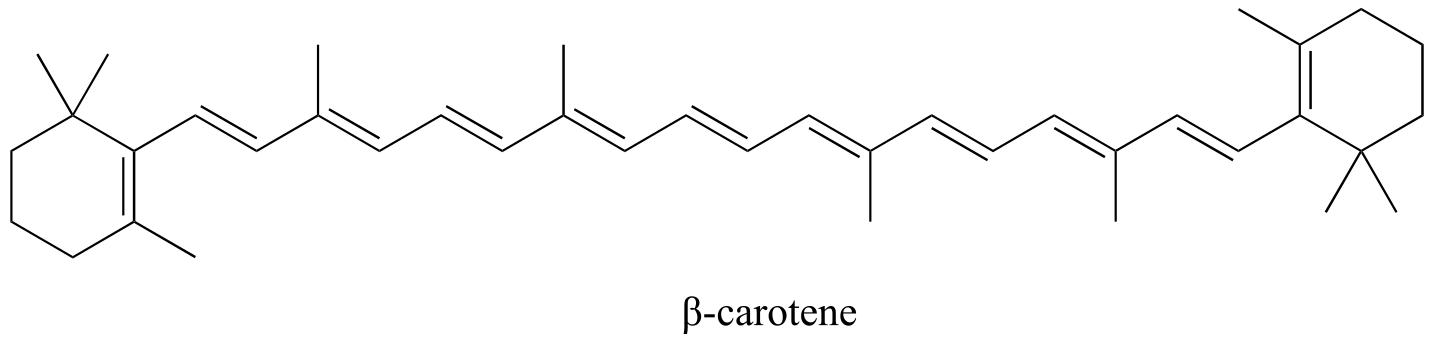
fig 15
Exercise 4.9: What is the energy of the photons (in kJ/mol) of light with wavelength of 470 nm, the λmax of β-carotene?
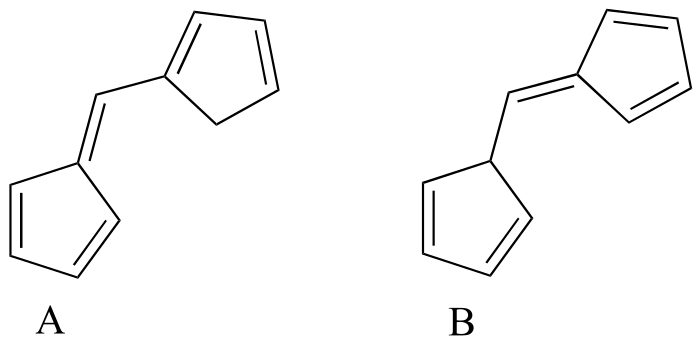
Exercise 4.10: Which of the following molecules would you expect absorb at a longer wavelength in the UV region of the electromagnetic spectrum? Explain your answer.
.pdf+-+SumatraPDF_2012-12-13_21-26-52.png)
fig19a
Protecting yourself from sunburn
Human skin can be damaged by exposure to ultraviolet light from the sun. We naturally produce a pigment, called melanin, which protects the skin by absorbing much of the ultraviolet radiation. Melanin is a complex polymer, two of the most common monomers units of which are shown below.
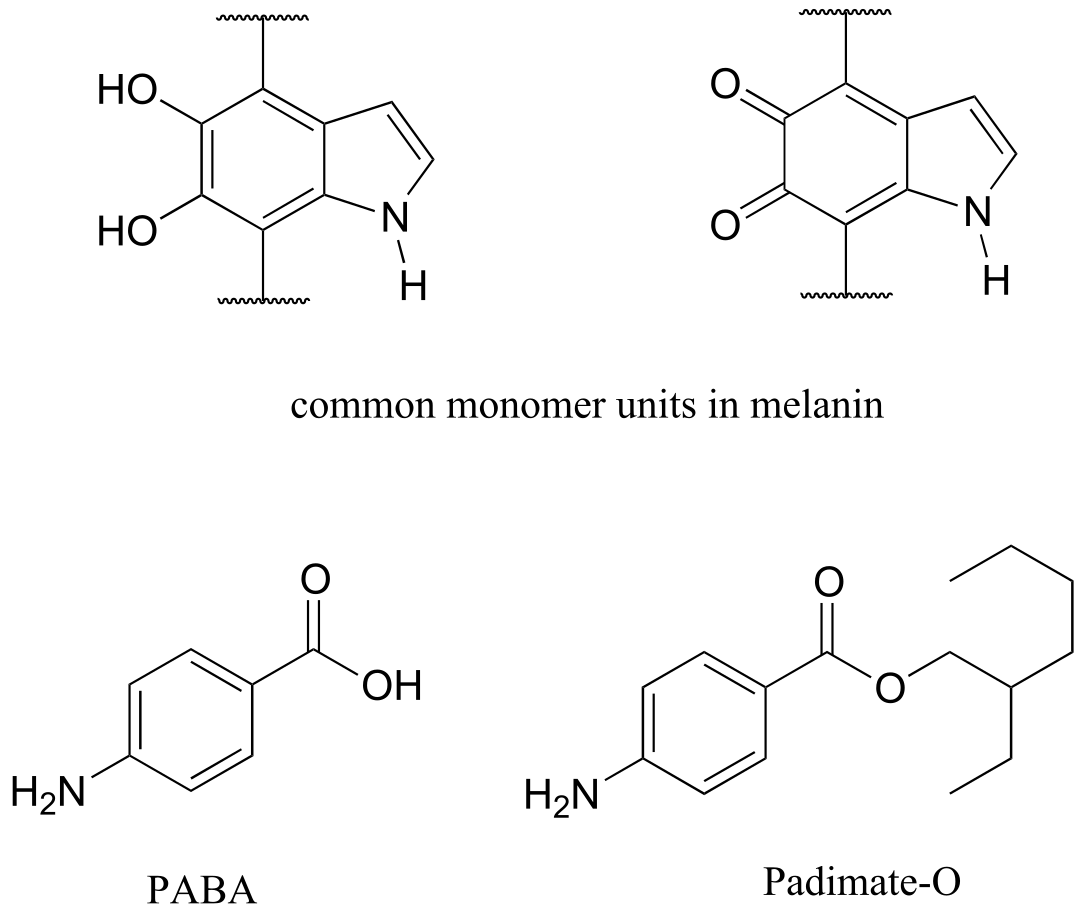
Overexposure to the sun is still dangerous, because there is a limit to how much radiation our melanin can absorb. Most commercial sunscreens claim to offer additional protection from both UV-A and UV-B radiation: UV-A refers to wavelengths between 315-400 nm, UV-B to shorter, more harmful wavelengths between 280-315 nm. PABA (para-aminobenzoic acid) was used in sunscreens in the past, but its relatively high polarity meant that it was not very soluble in oily lotions, and it tended to rinse away when swimming. Many sunscreens today contain, among other active ingredients, a more hydrophobic derivative of PABA called Padimate O.
fig 19b
(J. Investigative Derm. 1991, 97, 340; Photchem Photobiol. 1982, 35, 581)
4.4B: Looking at UV-vis spectra#
We have been talking in general terms about how molecules absorb UV and visible light – now let’s look at some actual examples of data from a UV-vis absorbance spectrophotometer. The setup is conceptually the same as for IR spectroscopy: radiation with a range of wavelengths is directed through a sample of interest, and a detector records which wavelengths were absorbed and to what extent the absorption occurred. Below is the absorbance spectrum of an important biological molecule called nicotinamide adenine dinucleotide, abbreviated NAD+. The adenine nucleotide base in the compound absorbs light in the neighborhood of 260 nm, which is within the UV range of the electromagnetic spectrum.

fig 16
The convention in UV-vis spectroscopy is to show the baseline at the bottom of the graph with the absorbance bands pointing up (opposite to the way IR spectra are normally plotted). Wavelength values on the x-axis are generally displayed in nanometer (nm) units. On the y-axis is a measure of how much light was absorbed at each wavelength, expressed as absorbance (A). The absorbance value contains the same information as the ‘percent transmittance’ number usually used in IR spectroscopy, just expressed in different terms. To calculate absorbance at a given wavelength, the computer in the spectrophotometer simply takes the intensity of light at that wavelength before it passes through the sample (I0), divides this value by the intensity of the same wavelength after it passes through the sample (I), then computes the log10 of that number.
equation 4.4 A = log (I0/I)
Note that in this expression the units cancel, so A is a unitless value.
Typically, there are two things that we look for and record from a UV-Vis spectrum. The first is λmax, the wavelength at maximal absorbance, which visually is the very top of the broad absorbance band. We also record the value of A at λmax, which depends on the concentration of the sample. The NAD+ spectrum above shows a maximal absorbance of 1.0 at 260 nm. In the next section, we will see how we can use this data to calculate the concentration of NAD+ in the sample.
Exercise 4.11: Express A = 1.0 in terms of percent transmittance (%T, the unit usually used in IR spectroscopy (and sometimes in UV-vis as well).
Here is the absorbance spectrum of the common food coloring Red #3:

fig 17
Here, we see that the extended system of conjugated π bonds causes the molecule to absorb light in the visible range - specifically, with a λmax of 524 nm, which is in the blue/green range. Red wavelengths pass through without being absorbed, so the solution appears red to our eyes.
Now, take a look at the spectrum of another food coloring, Blue #1:

fig 18
Maximum absorbance is at 630 nm, in the orange range of the visible spectrum, and the compound appears blue.
4.4D: Applications of UV spectroscopy in organic and biological chemistry#
UV-Visible spectroscopy has many applications in organic and biological chemistry. The Beer - Lambert Law is often used to determine the concentration of a UV-active sample. You most likely have performed a Beer – Lambert experiment in a General Chemistry lab. The law is simply an application of the observation that, within certain ranges, the absorbance of UV-active compound at a given wavelength varies in a linear fashion with its concentration: the higher the concentration, the greater the absorbance.
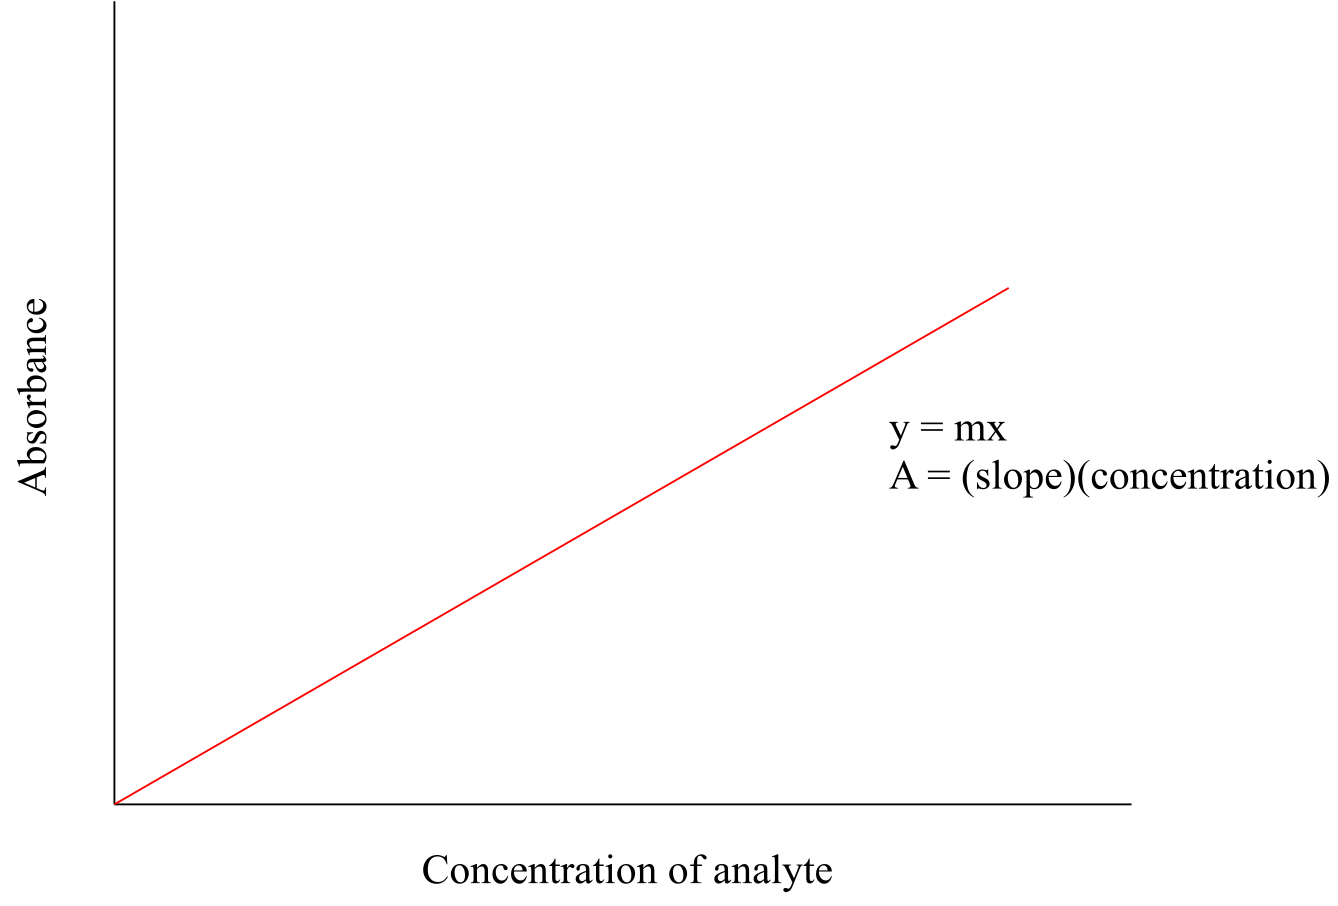
fig 31
If, for a particular sample, we divide the observed value of A at λmax by the concentration of the sample (c, in mol/L), we obtain the molar absorptivity, or extinction coefficient (ε), which is a characteristic value for a given compound that we can look up.
equation 4.5 ε = A/cl
In the above equation, ‘l ‘ is path length - the distance that the beam of light travels though the sample - expressed in cm. Most sample holders are designed with a path length of1.0 cm, so the conventional unit for molar absorptivity is L⋅mol-1⋅cm-1. In all UV-Vis discussion or problems in this book, you should assume that the relevant path length is 1.0 cm.
For example: In the spectrum of NAD+ (section 4.3C), we see that A = 1.0 at the λmax of 260 nm. We look up the molar absorptivity of NAD+ at 260 nm and find that it is listed as ε(260) = 18,000 L⋅mol-1⋅cm-1. Using equation 4.4, it is easy to calculate that the concentration of the sample is 5.6 x 10⁻⁵ M.
The bases of DNA and RNA are good chromophores:
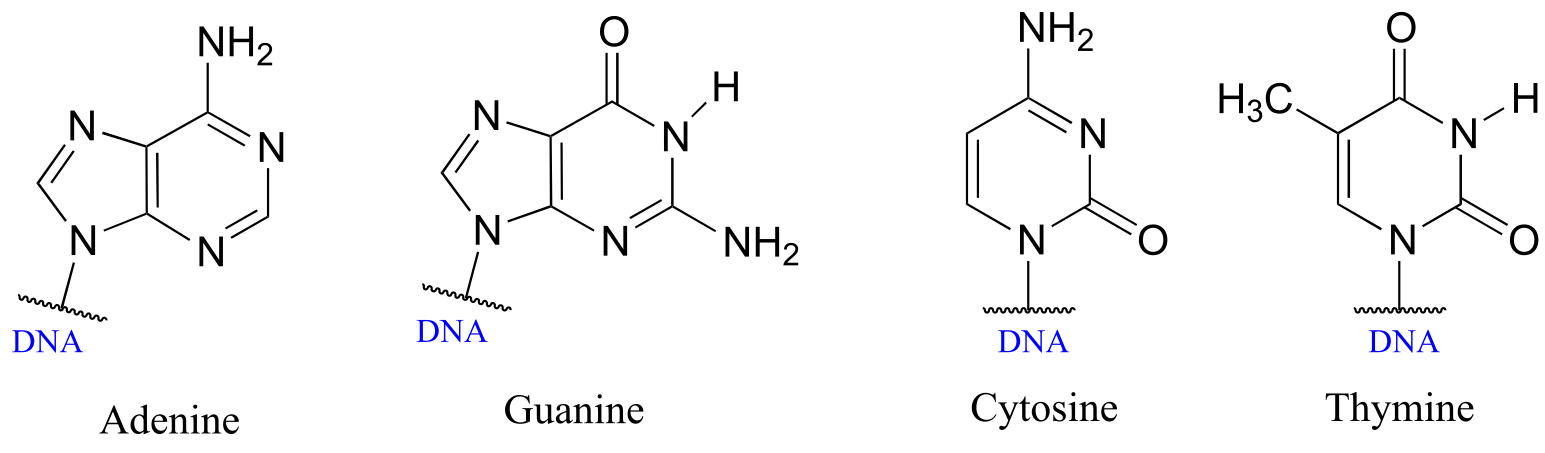
fig 20
Biochemists and molecular biologists often determine the concentration of a DNA or oligonucleotide sample by assuming an average value of ε(260) = 0.020 μL⋅ng-1⋅cm-1 for double-stranded DNA at its λmax of 260 nm (notice that concentration here is expressed in terms of mass rather than moles: nanograms per microliter is a convenient unit for DNA concentration when doing molecular biology).
Exercise 4.12: 50 μL of an aqueous sample of double stranded DNA is dissolved in 950 μL of water. This diluted solution has a maximal absorbance of 0.326 at 260 nm. What is the concentration of the original (more concentrated) DNA sample, expressed in ug/μL?
Because the extinction coefficient of double stranded DNA is slightly lower than that of single stranded DNA, we can use UV spectroscopy to monitor a process known as DNA melting, an important factor in molecular cloning experiments. If a short stretch of double stranded DNA is gradually heated up, it will begin to ‘melt’, or break apart, as the temperature increases (recall that two strands of DNA are held together by a specific pattern of hydrogen bonds formed by ‘base-pairing’).
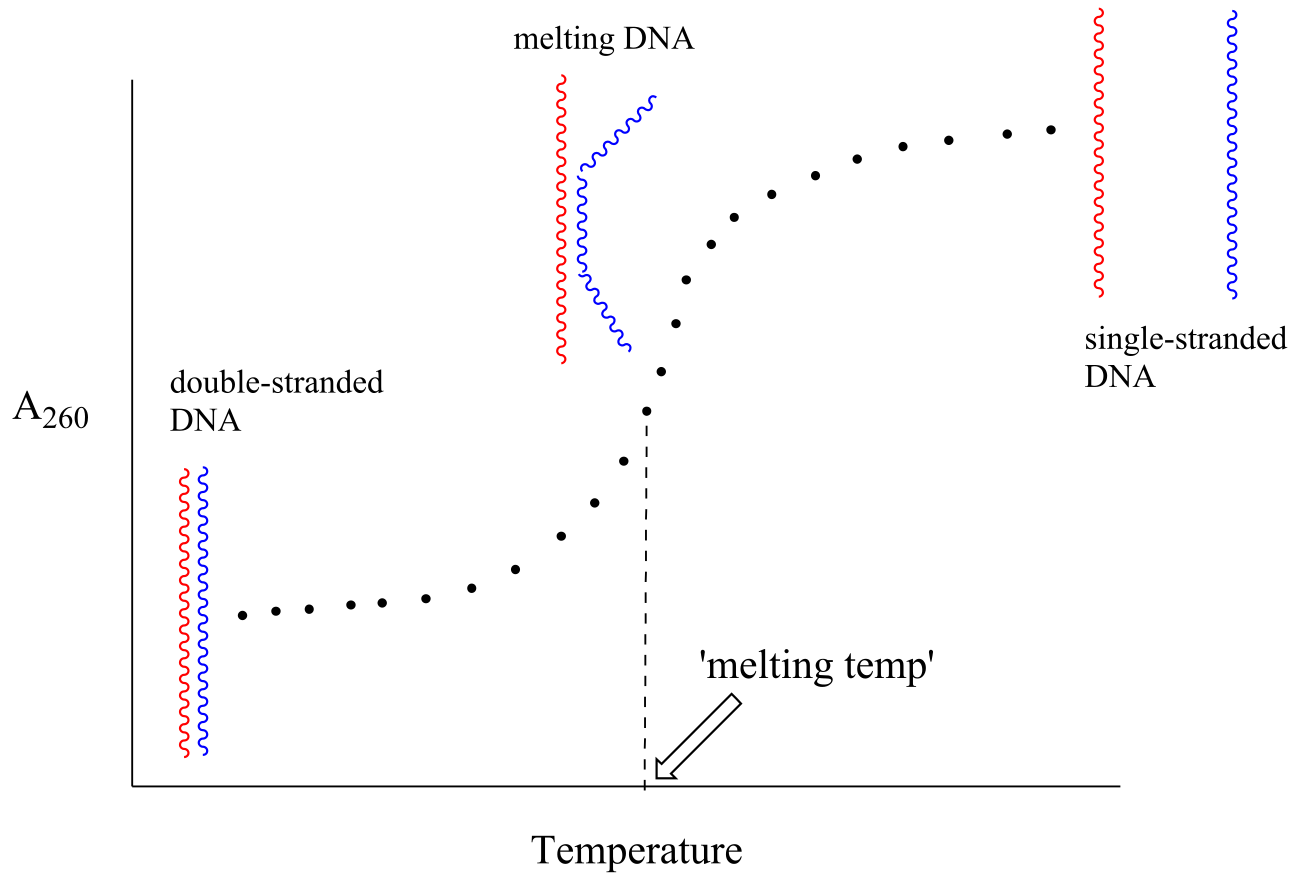
fig 21
As melting proceeds, the absorbance value for the sample increases, eventually reaching a high plateau as all of the double-stranded DNA has melted into two strands. The mid-point of this process, called the ‘melting temperature’, provides a good indication of how tightly the two complementary strands of DNA are able to bind to each other.
In chapter 15 we will see how the Beer - Lambert Law and UV spectroscopy provides us with a convenient way to follow the progress of many different enzymatic redox (oxidation-reduction) reactions. In biochemistry, oxidation of an organic molecule often occurs concurrently with reduction of nicotinamide adenine dinucleotide (NAD+, the compound whose spectrum we saw earlier in this section) to NADH:
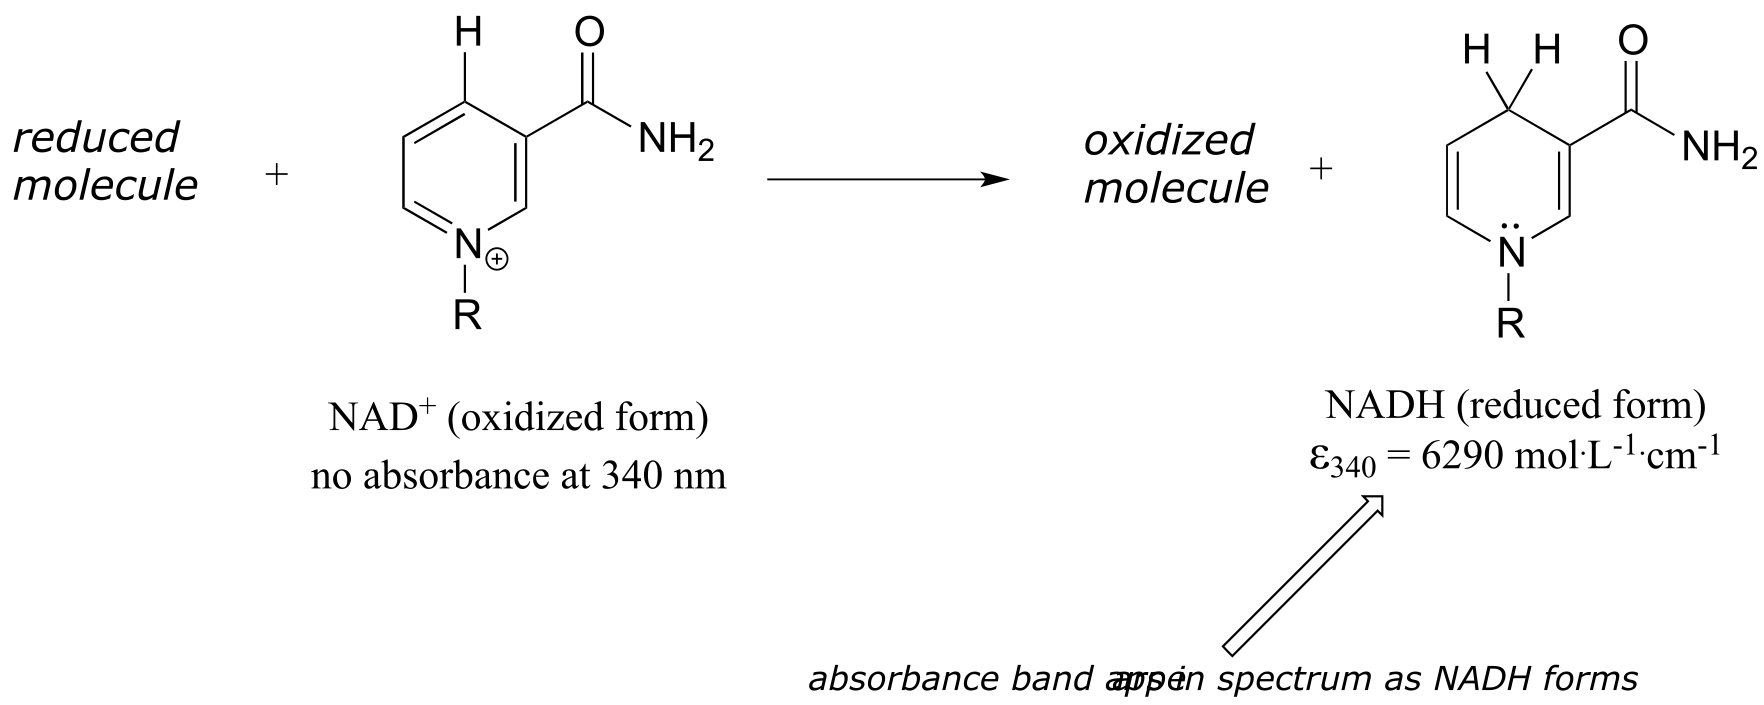
fig 22
Proteins absorb light in the UV range due to the presence of the aromatic amino acids tryptophan, phenylalanine, and tyrosine, all of which are chromophores. Many coenzymes are also UV-active.
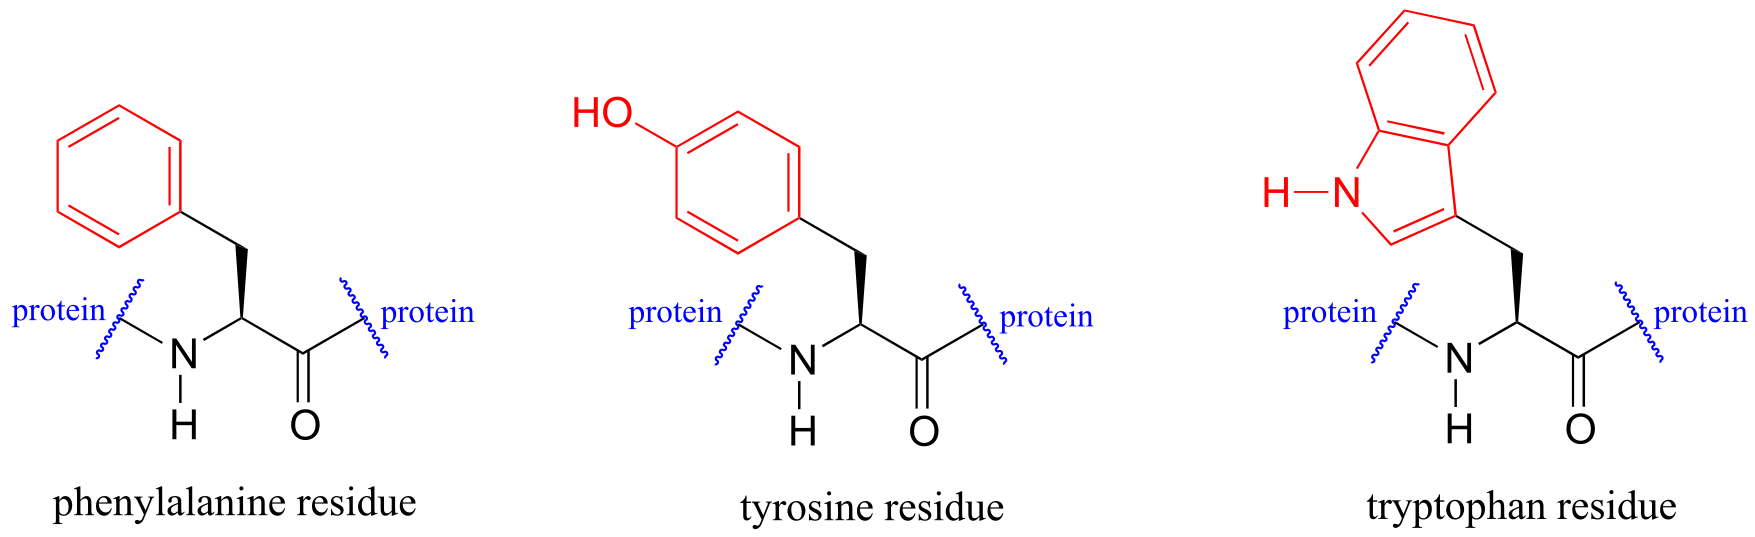
fig 24
Biochemists have used UV spectroscopy to study conformational changes in proteins - how they change shape in response to different conditions. When a protein undergoes a conformational shift (due to binding of a ligand, for example), the resulting change in the environment around an aromatic amino acid or coenzyme chromophore can cause the UV spectrum of the protein to be altered.
Note: It will be very helpful for you to look at many more real examples of mass spectrometry and infrared /ultraviolet-visible spectroscopy data than are provided in this chapter - you can do this at the Spectral Database for Organic Compounds.
Key concepts for review#
Mass spectrometry:
Understand the fundamentals of an MS experiment.
In a given mass spectrum, recognize the molecular ion peak along with M+1 and M+2 peaks and be able to explain what these are and why they are there.
Recognize characteristic mass spectral data for chloro- and bromo-alkanes (M+2 peaks in 1:1 or 3:1 ratios, respectively).
Spectrometry basics:
Be able to put the following regions of the electromagnetic spectrum in order from shortest to longest wavelength: gamma radiation, x-rays, ultraviolet, blue visible light, red visible light, infrared, microwave, radio wave.
Be able to mathematically convert among the following: wavelength expressed in meters, wavelength expressed in wavenumbers (cm-1), frequency, and energy in kJ/mol of photons. Non-quantitatively, you should be able to quickly recognize relationships between the above: in other words, you should have internalized the idea that radiation with shorter wavelengths corresponds to higher wavenumbers, higher frequency, and higher energy.
Be able to describe, in ‘generic’ terms, a molecular spectroscopy experiment, and understand its elements: a spectrum of wavelengths passing into a sample, a quantum transition from a ground to an excited state in the sample molecules with absorbance of corresponding wavelength(s) of radiation, and detection of wavelengths absorbed along with the intensity of each absorbance.
IR spectroscopy:
Understand the basic idea of a vibrational transition
Be able to identify IR-active and inactive functional groups, and predict which functional groups will lead to more intense absorbance (ie., those with greater dipole moments)
Based on an IR spectrum, be confident in predicting the presence (or absence) of the functional groups listed in table x.
UV-visible spectroscopy:
Understand the basic idea of an electronic (π → π*; n → π*) transition.
Be able to recognize a chromophore.
Be able to predict trends in absorbance maxima based on degree of conjugation. Be able to use the Beer-Lambert Law to do simple calculations (eg. figuring out concentration of a compound based on observed A and literature value of molar absorptivity).
Problems#
P4.1: Which represents a higher energy frequency of electromagnetic radiation, 1690
cm-1 or 3400 cm-1? Express each of these in terms of wavelength (meters) and frequency (Hz).
P4.2: Calculate the value, in kJ/mol, of the ∆E associated with a typical alkyne carbon-carbon stretching frequency at 2100 cm-1.
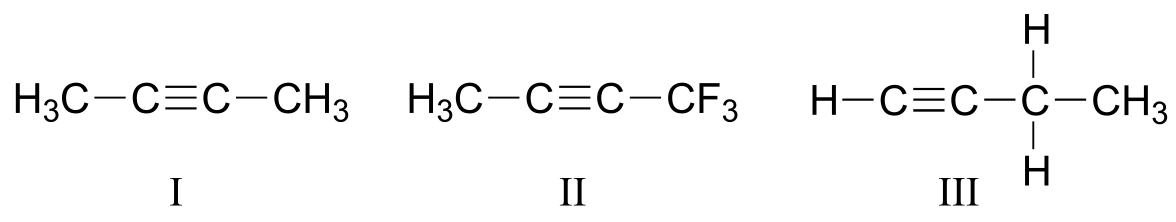
P4.3: Explain how you could use IR spectroscopy to distinguish between compounds I, II, and III.
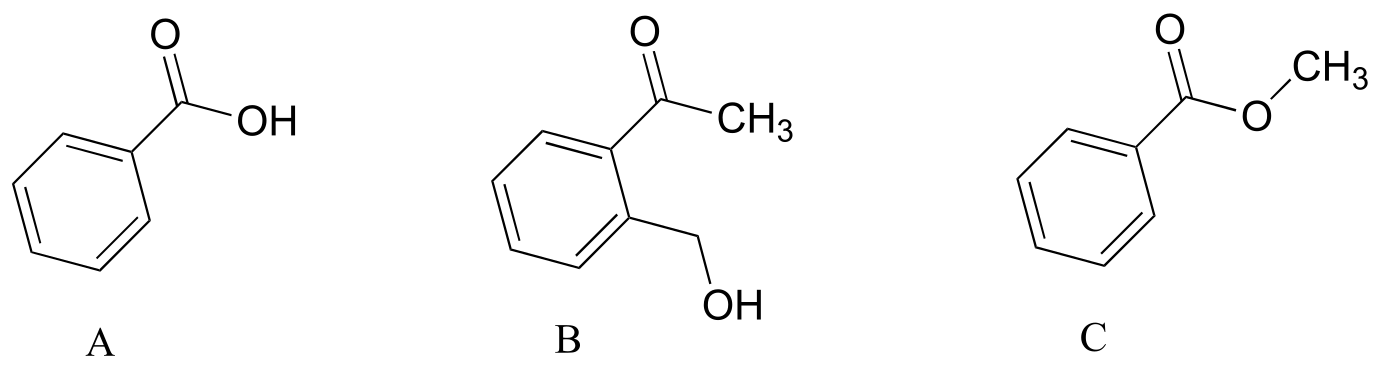
P4.4: Explain how you could use IR spectroscopy to distinguish between compounds A, B, and C.
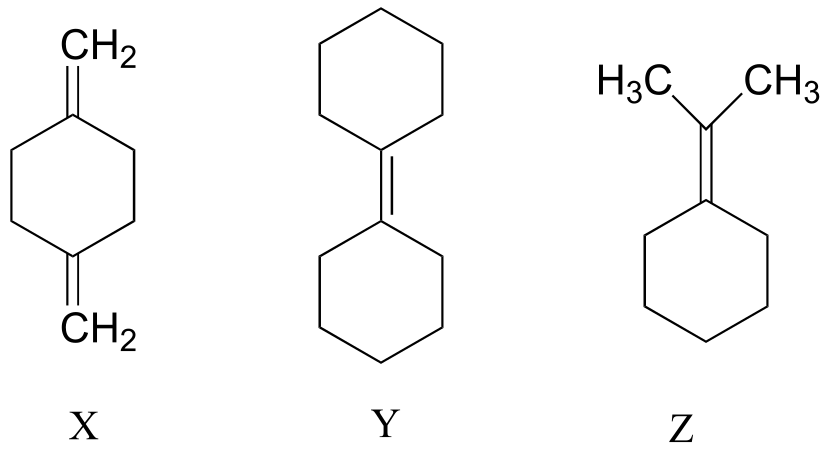
P4.5: Explain how you could use IR spectroscopy to distinguish between compounds X, Y, and Z.
P4.6: A 0.725 mL aqueous solution of NADH shows an absorbance at 340 nm of A = 0.257. Express (in nanomole (nm) units) how much NADH is contained in the sample.
P4.7: A 1 mL enzymatic reaction mixture contains NADH as one of the reactants, and has a starting A340 = 0.345. After the reaction is allowed to run for five minutes, the researcher records a value of A340 = 0.125. How many nm of NADH are used up per minute, on average, in this reaction?
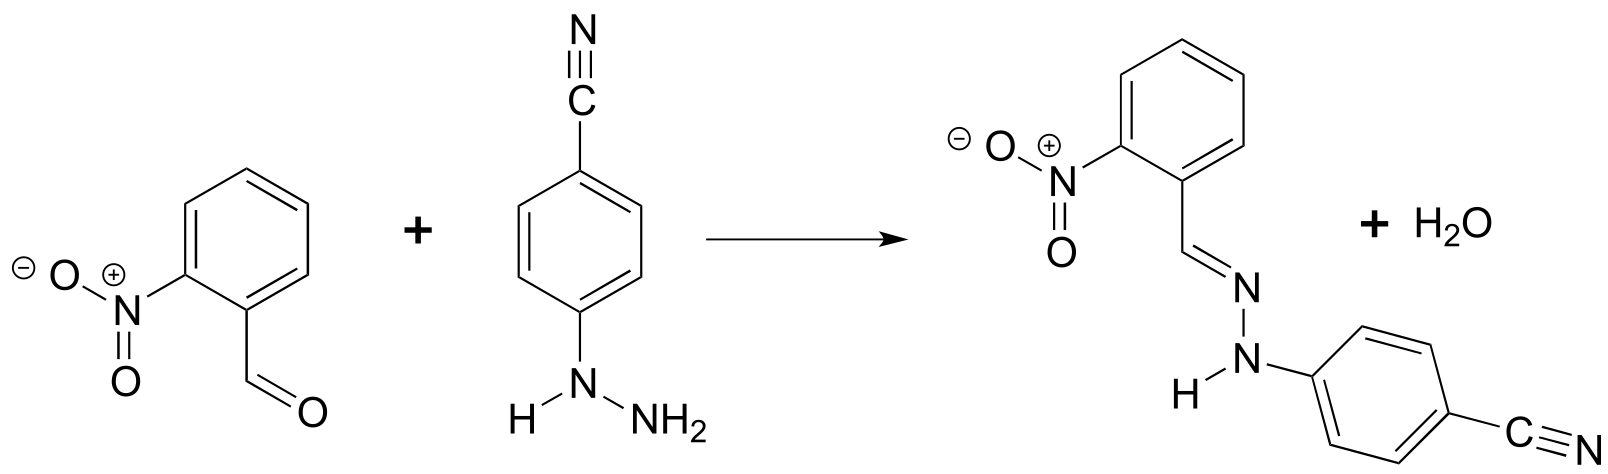
P4.8: The reaction below is of a type that we will study in Chapter 11. While the two starting materials are only slightly colored, the product is an intense orange-red. Account for this observation.
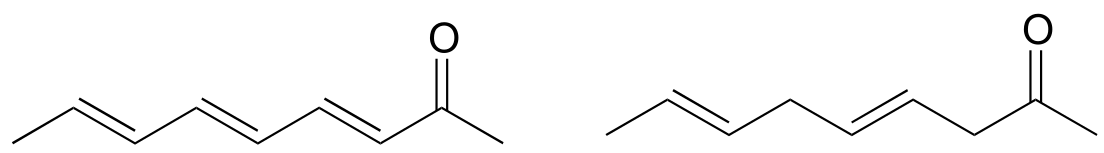
P4.9: Which would be more useful in distinguishing the two compounds shown below: IR or UV spectroscopy? Explain.
P4.10: Which analytical technique – IR, UV, or MS - could best be used to distinguish between the two compounds below? Explain.
P4.11: One would expect the mass spectrum of cyclohexanone to show a molecular ion peak at m/z = 98. However, the m/z = 98 peak in the cyclohexanone spectrum is unusually abundant, compared to the molecular ion peaks in the mass spectra of other ketones such as 2-hexanone or 3-hexanone. Explain.